Understanding Economic Bifurcation


Watching the news today, it is very possible to be confused about the status of the economy. Consumer spending is up, but credit card debt is also up; auto vehicle sales are up on average as are auto loan delinquencies; and housing prices are up while home sales have slowed. This good news/bad news can be very puzzling for many people trying to understand the actual state of the economy. A potential reasoning for this up and down is because of “economic bifurcation” or a “K-shaped economy.” In simple terms, it means the higher-income groups are succeeding economically while the lower-income groups are struggling. This divergence between the groups speaks to the K-shape where one group moves up and the other moves down.
Often the economy is only discussed in aggregate, meaning how the economy as a whole is doing. However, that generalization can often conceal information on how different groups behave and respond to economic events. This holds true when there is a conversation about consumer spending, inflation, home purchases, and more. Simply put, different income groups can have vastly different experiences. One way to see how the experience of some groups can be obscured is by comparing CPI and core CPI (excluding food and fuel). Many economists focus on core CPI because it is less likely to fluctuate and may be more controlled by fiscal and monetary policy. However, this can distort the lived experience of many Americans for whom food and fuel are a disproportionately large portion of their budget. Growth of these non-core CPI items leaves little room for fluctuations of price or increased consumer spending in other areas. The little that is left in lower-income Americans’ budgets may be further eroded by the rising prices of housing, insurance, automobiles, and other items. While higher prices may also impact wealthier groups, their budgets are more likely to be able to absorb such shocks rather than reduce spending or delay paying bills.
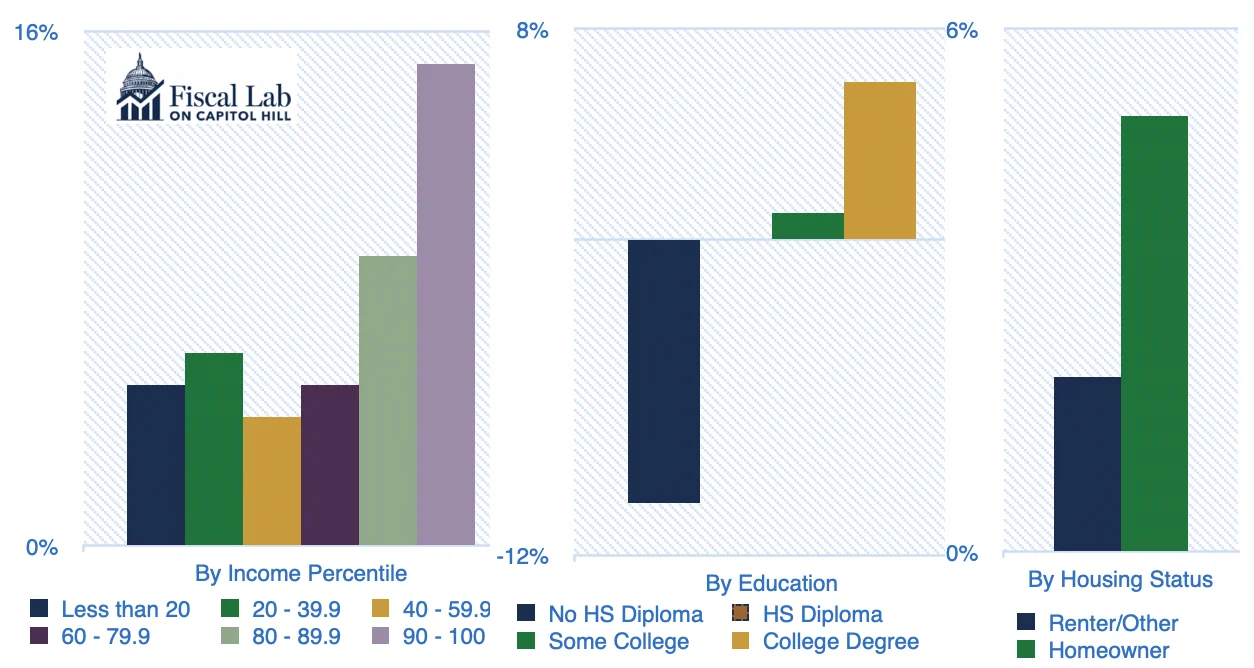
One measure to track how different income groups are performing is the Federal Reserve Board Survey of Consumer Finances, conducted every three years, last published in 2022. This survey is a national examination of families’ financial situations and allows for snapshots over time and the calculation of growth rates. As observed in Figure 1, real income growth by percentiles, education, and homeownership can be examined to see how families’ finances are performing. While education and homeownership are not pure predictors of economic status, historically those with higher education and homeownership have fared economically better than their counterparts. Those with higher initial income are more likely to experience greater real income growth with a disproportionate growth observed for the wealthiest 10 percent. Those without a high school degree experienced a significant reduction in income over the 2019 to 2022 time period, while those with a college degree experienced a 6 percent growth. Finally, homeowners had their income grow at 5 percent relative to renters who showed only a 2 percent growth. Each of these measures speaks to the bifurcation of the economy and how the wealthier, more educated, homeowners are watching their incomes rise faster, while their less wealthy counterparts’ incomes are growing at a much lower rate or falling.
Figure 1. Median real income growth rates from 2019 to 2022
Citation: Survey of Consumer Finances | Federal Reserve Board of Governors
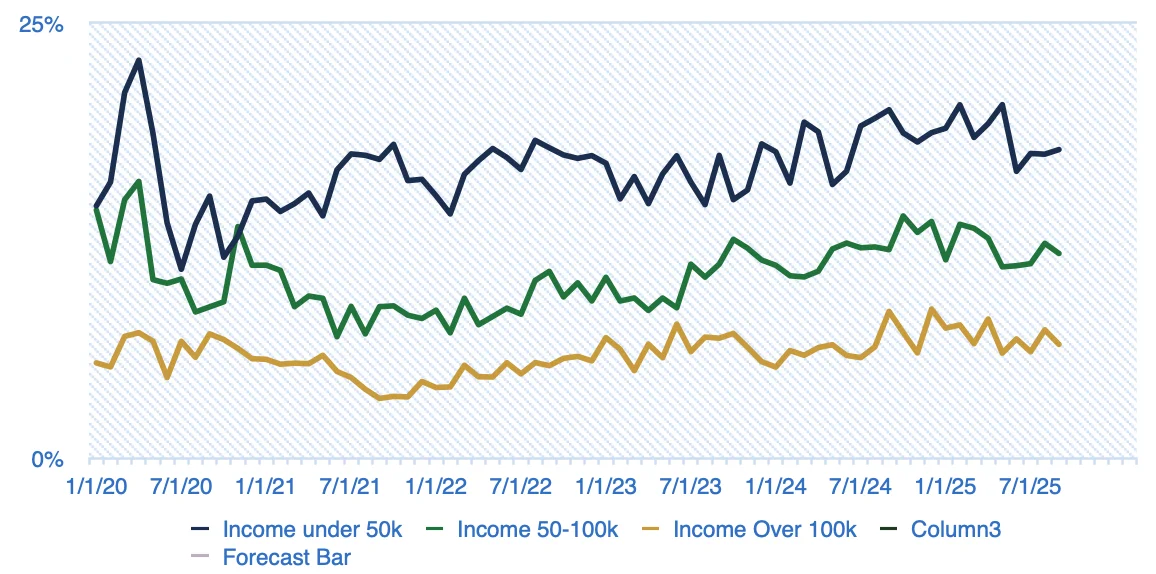
While Figure 1 illustrates how some groups are faring better than others, income growth only tells one part of the story. The New York Federal Reserve looks at a survey of consumer expectations and while they do not provide breakouts by income percentile, they do bucket incomes: under $50,000, between $50,000 and $100,000, and over $100,000. Figure 2 is based upon individual responses on the percent chance that someone may not make the minimum payment on one of their debts over the next three months. Historically, and perhaps unsurprisingly, lower-income individuals have greater concerns about making their minimum payments to avoid delinquency than those with incomes above $100,000. Those with lower real income growth, potentially eroded by higher inflation, who are struggling to make their student loan, credit card, or auto loan payments, is another example of a bifurcated economy. This concern of keeping up on minimum debt requirements can be especially challenging in a weaker economy where wages are stagnant and prices are rising.
Figure 2. Average concern of not making minimum debt payment over the next three months (estimated probability based on survey data)
Citation: Survey of Consumer Expectations | Federal Reserve Bank of New York
Anecdotal news stories and hard data show how those with lower incomes, education, or assets are doing worse than their counterparts. Those on the lower half of the “K-shape” are seeing their real incomes fall, or fail to keep up with the pace of others, and are worried about making minimum payments. This economic bifurcation is one of the reasons people may feel that the general economic picture discussed in the news doesn’t match their daily experience. The divergence of success versus struggle clearly speaks to the K-shape that is being observed in the data. These are just two illustrations of the meaning of the term economic bifurcation.