A Preliminary Review & Analysis of the February 2026 CBO Budget and Economic Outlook
Introduction
On February 11, 2026, the Congressional Budget Office (CBO) published its most recent edition of the Budget and Economic Outlook. The Budget and Economic Outlook is a regular update, usually in February, of CBO’s baseline projections of what the federal budget and the US economy would look like, holding current laws affecting taxes and spending constant.[1]
Although the Budget and Economic Outlook is generally published twice per year, this report was only published once last year in January 2025. Notably, this most recent update includes substantial changes owing to the passage of the One Big Beautiful Bill Act (OBBBA) and changes in trade policy.
This policy brief reviews the main takeaways from CBO’s baseline projections. It also explains how America’s fiscal trajectory is primarily driven by projected growth in mandatory outlays, which contribute to persistent primary deficits and, in turn, rising net interest payments.
The Federal Budget
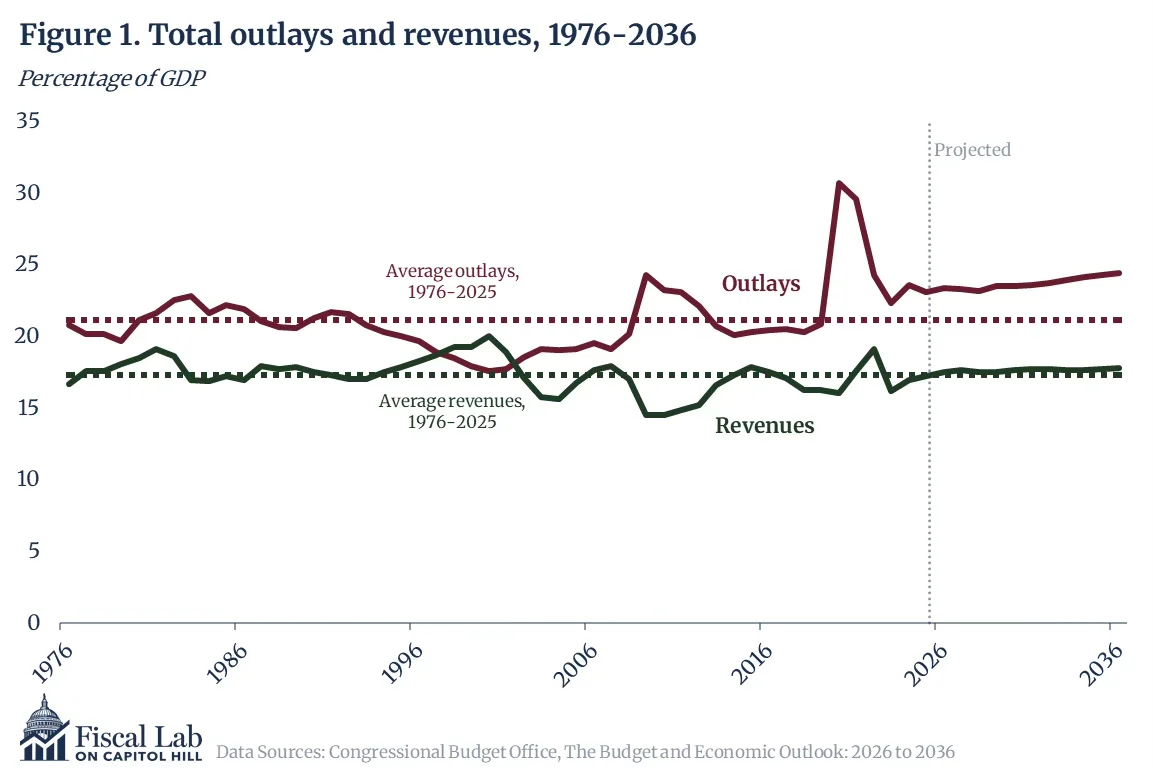
As the CBO observes, outlays, total deficits, net outlays for interest, and primary deficits are all “large by historical standards.”[2.The Budget and Economic Outlook: 2026 to 2036 (Congressional Budget Office, February 11, 2026), 11.] Revenues rise modestly as a percentage of GDP. As illustrated in Figure 1, outlays have persistently been above revenues since 2001 and are projected to exceed revenues by a widening margin.
The historically large difference between outlays and revenues causes debt held by the public to rise from 101 percent of GDP to 120 percent by 2036, which is significantly higher than the previous record of 106 percent following World War II.[2] By 2056, this number, as illustrated in Figure 2, is expected to rise even further to 175 percent.
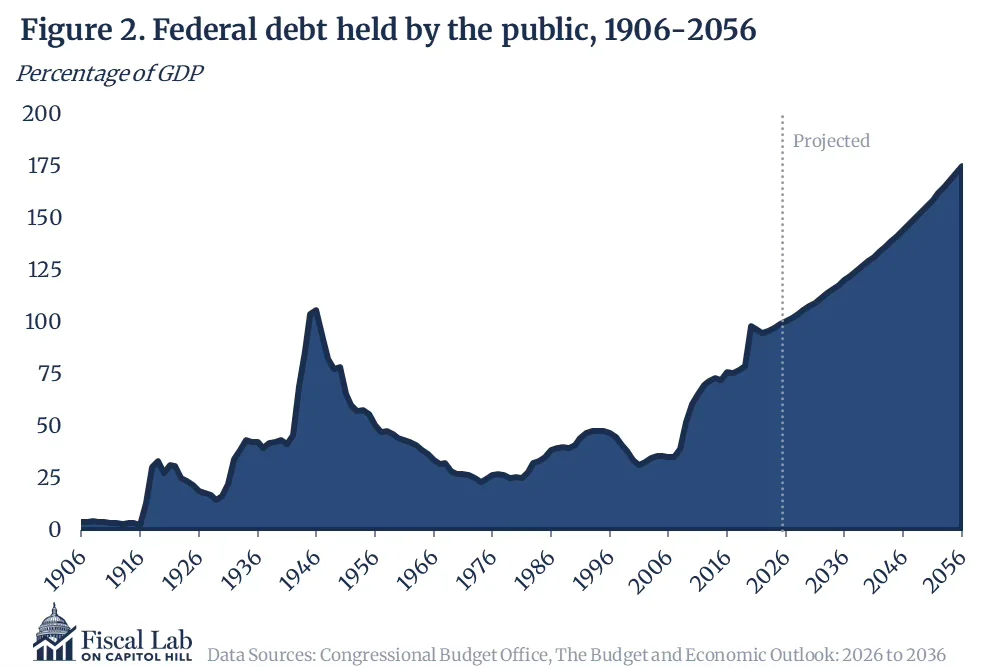
Such large deficits and total debt are especially alarming given that the United States is experiencing a period of relative peace and prosperity. Unlike in the years following World War II, the population is also aging rapidly, meaning fewer workers to sustain economic growth and tax revenue.
The deteriorating fiscal situation means less fiscal space for emergencies and a larger debt burden to be financed through some combination of spending cuts, higher taxation, and inflation. Moreover, with revenues close to their historical patterns as a percentage of GDP, this fiscal trajectory can chiefly be viewed as a problem driven by excessive spending.
2a. Deficit
The annual federal budget deficit is expected to reach $1.9 trillion and 5.8 percent of GDP in 2026 and $3.1 trillion and 6.7 percent of GDP by 2036. A total deficit includes the primary deficit, what the government must borrow before paying interest on existing debt, plus net interest outlays. Figure 3 shows the historical budget deficit from 1976 through today and the projected deficit over the next 10 years. The figure shows that an increasing share of the budget deficit is expected to simply pay the interest on existing debt.
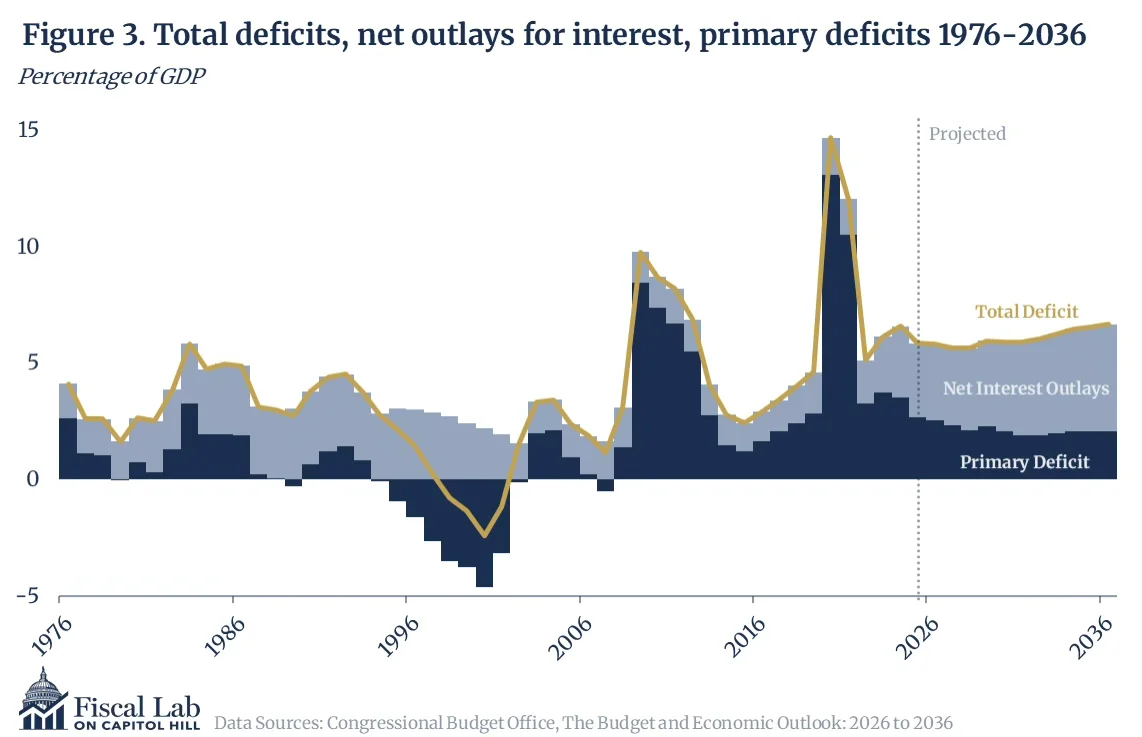
Since last January, the CBO has revised its cumulative 2026 - 2035 deficit upward from $21.8 trillion to $23.1 trillion. The upward revision reflects an additional $3.4 trillion in projected deficits, largely from the OBBBA; an additional $0.7 trillion in interest costs; and a partially offsetting $2.7 trillion increase in revenue, largely from increased tariff rates.
2b. Outlays
Federal outlays (spending) consist of mandatory outlays, discretionary outlays, and net interest outlays. Mandatory outlays are automatic spending authorized under existing law, including Social Security, Medicare, Medicaid, the Supplemental Nutrition Assistance Program (SNAP), and federal retirement programs. Discretionary outlays are appropriated annually by Congress and include spending for defense, education, scientific research, transportation, and law enforcement. Net interest outlays reflect the cost of servicing the federal debt.
As Figure 4 illustrates, mandatory and net interest outlays are projected to become larger shares of total outlays, while discretionary outlays shrink.
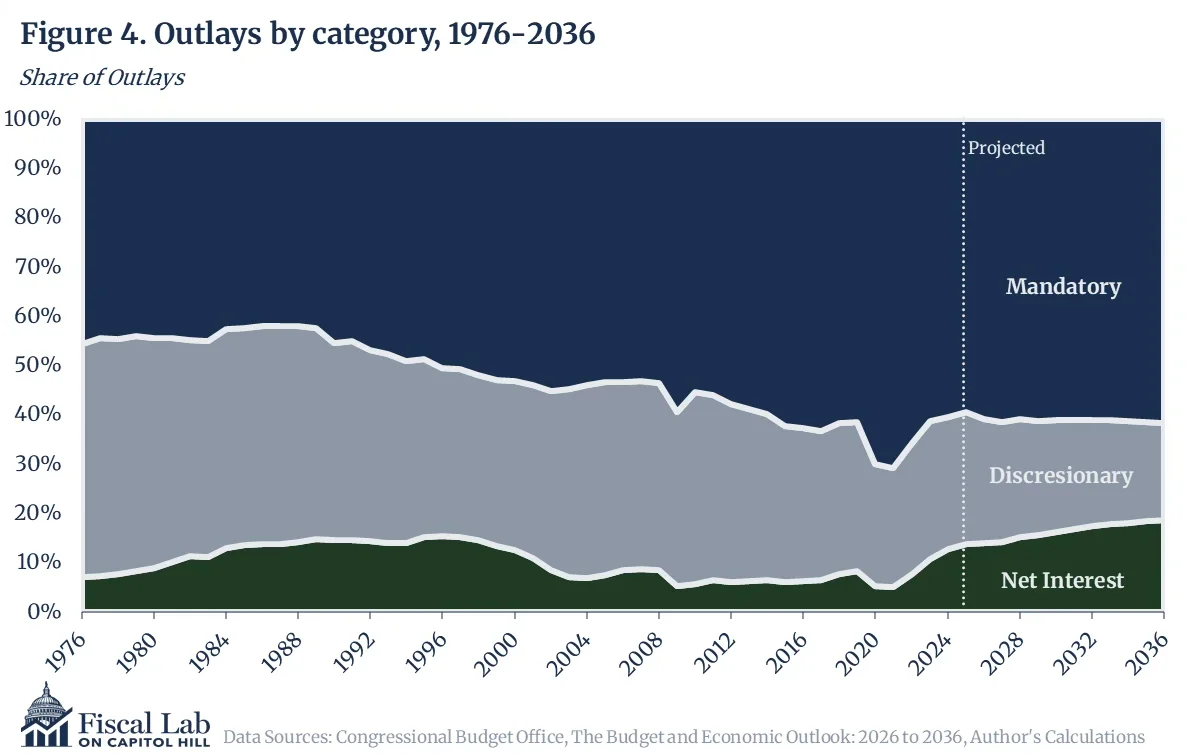
The increase in mandatory outlays largely reflects more spending on Social Security and Medicare as the population ages, while the increase in net interest outlays reflects higher total debt as well as a higher level of interest rates since 2021.
Notably, the CBO estimates that the OBBBA reduced mandatory outlay projections. For example, it reduces Medicaid outlays by $1.2 trillion and SNAP benefits by $211 billion.[3] However, despite these changes, mandatory spending is still the biggest contributor to federal primary deficits and will continue to be an even-larger driver of the total debt absent reform.
2c. Revenue
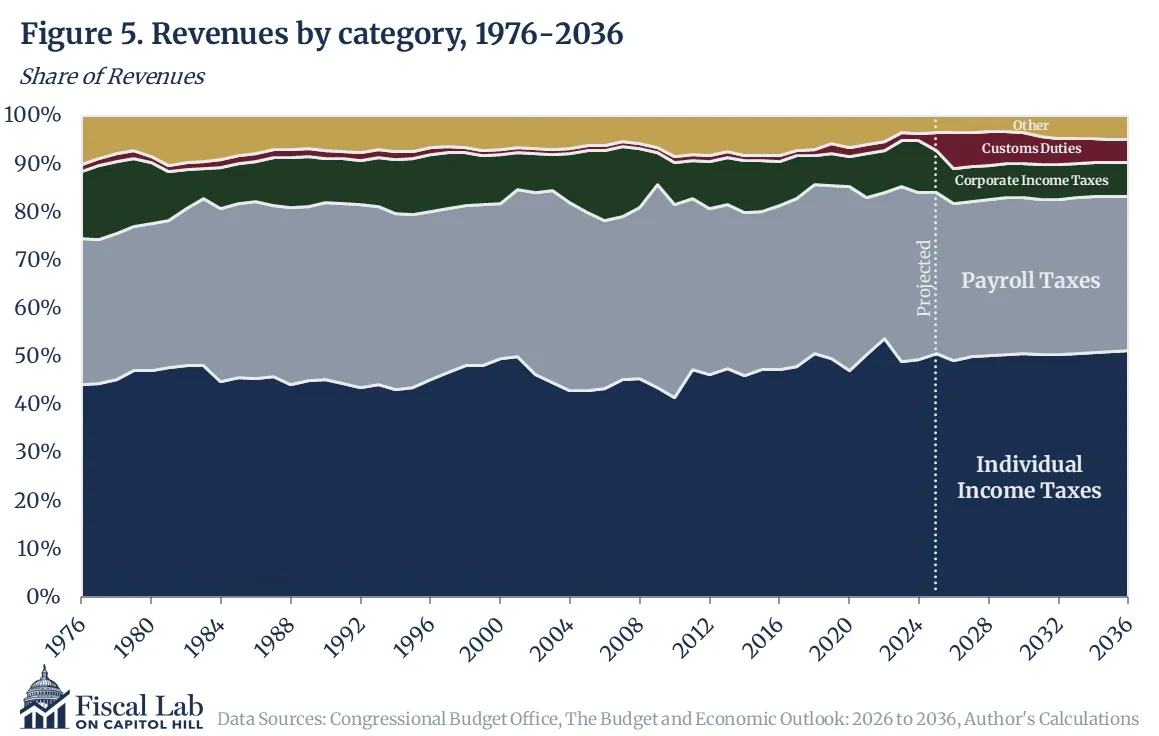
Figure 5 shows revenues from different tax sources. Payroll and corporate and individual tax revenue are all projected to be roughly stable. Changes in tariff policy cause the share of customs duties to initially rise but then decline over the projection period.
Economic Outlook
3a. Real GDP and Employment
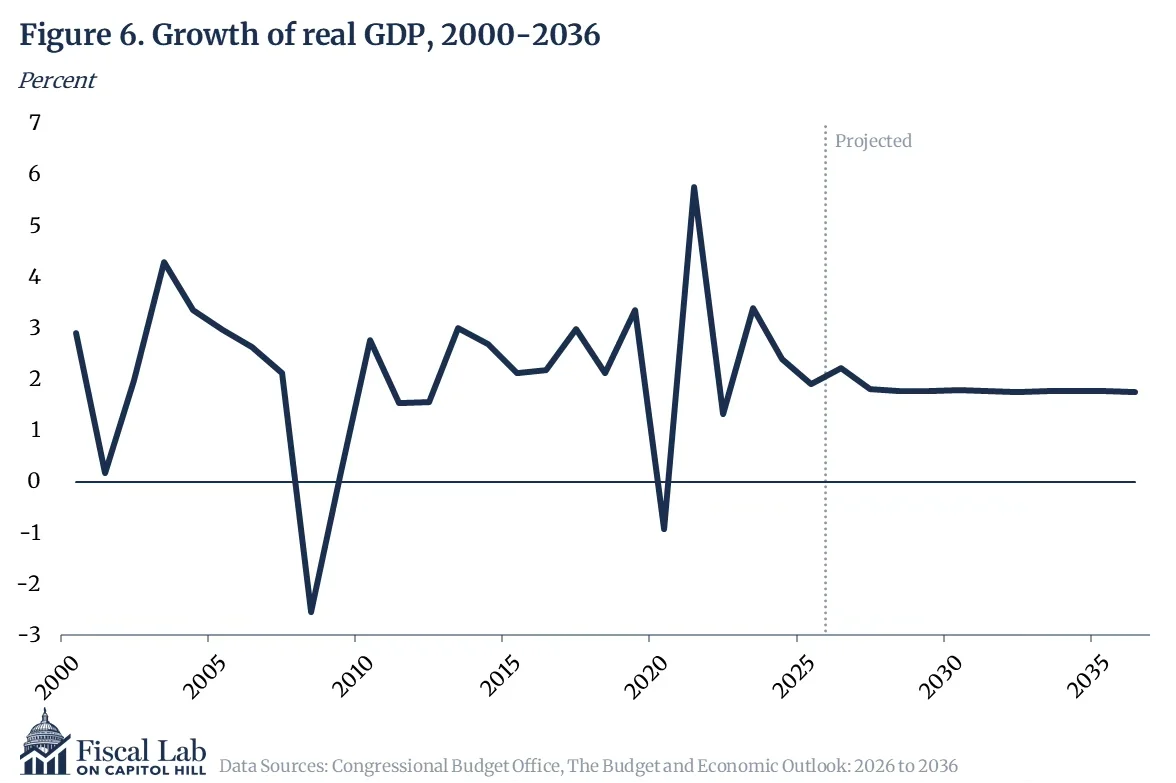
Real GDP is gross domestic product adjusted by changes in prices and is the most common measure of overall economic activity. CBO estimates that real GDP growth will rise to 2.2 percent in 2026 from 1.9 percent in 2025, partly reflecting the boost to consumer spending and investment from OBBBA. This increase is partially offset by increases in tariff rates and a fall in immigration. Real GDP growth then slows to an average of 1.8 percent per year. Like real GDP, total payroll employment is also expected to rise in 2026 but then fall afterward because of the aging population (see Figure 6).
3b. Inflation
The CBO expects inflation as measured by the Personal Consumption Expenditures (PCE) Price Index to fall modestly from 2.8 percent in 2025 to 2.7 percent in 2026. Inflation then falls to 2 percent, the Federal Reserve’s inflation target (see Figure 7).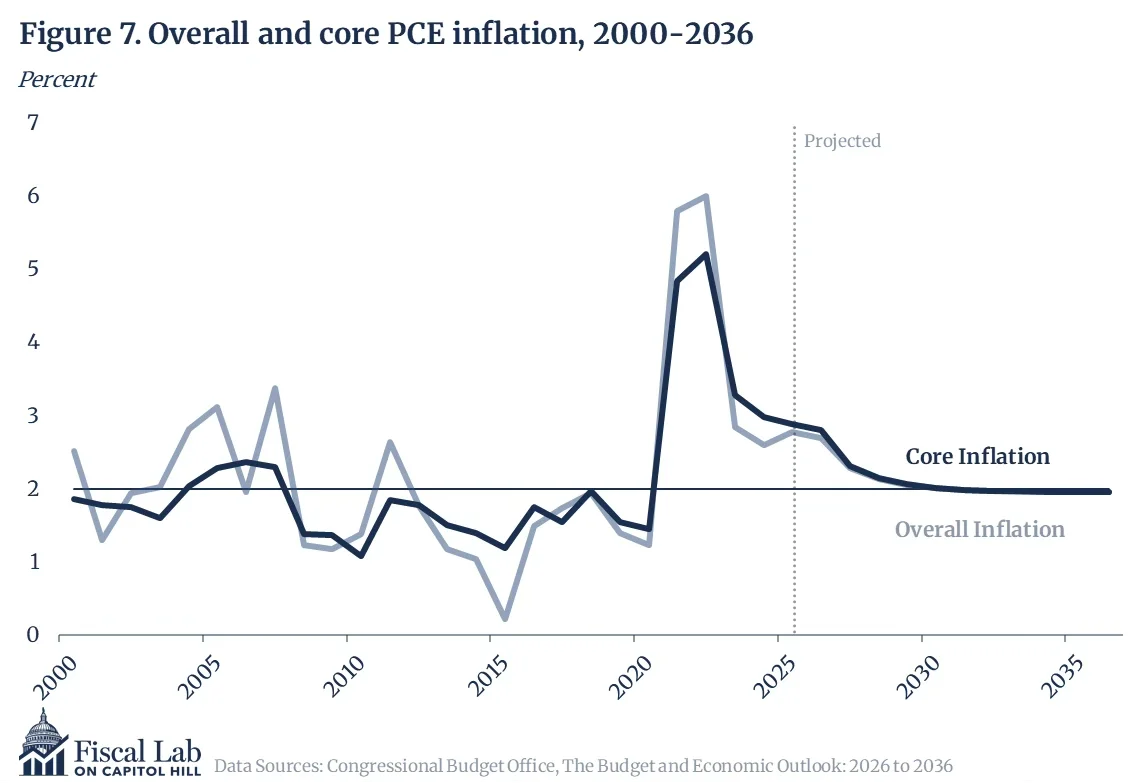
3c. Interest Rates
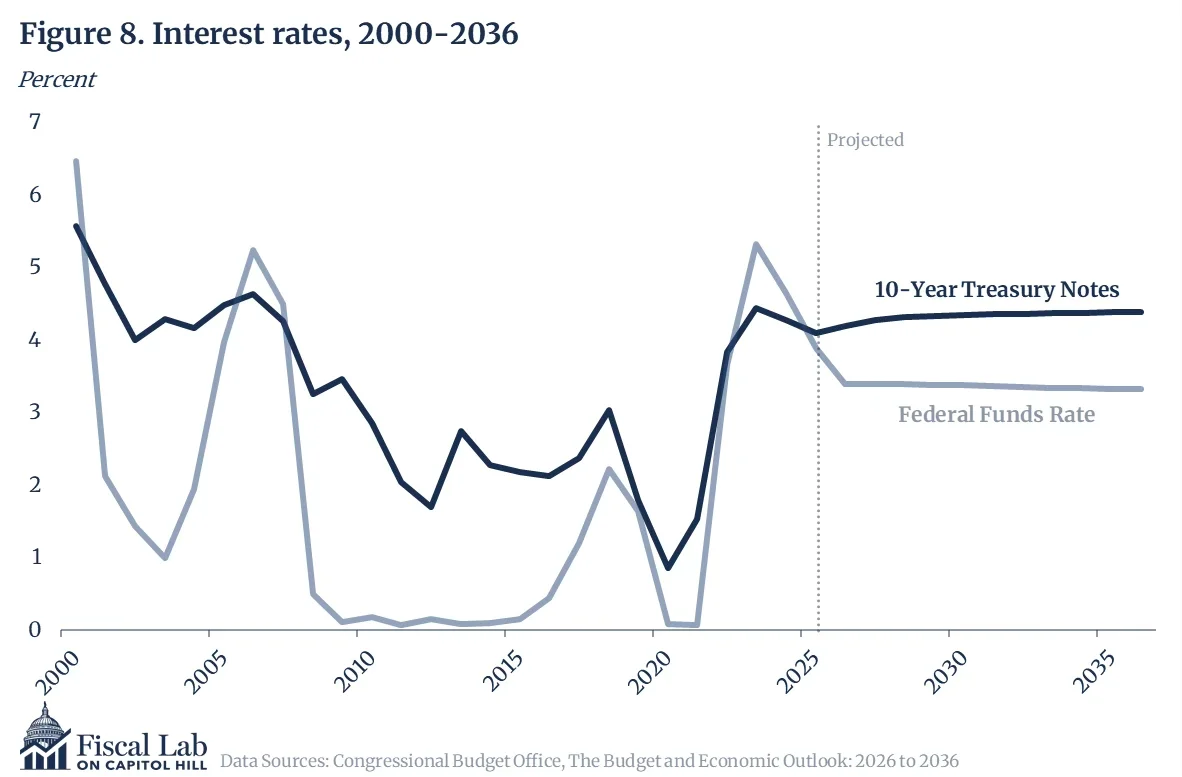
The Federal Reserve’s target interest rate, the federal funds rate, will fall to 3.4 percent by the end of 2026 and remain steady. By contrast, the 10-year Treasury note yield will gradually rise (see Figure 8). CBO attributes this rise to an increased term premium, or the extra yield investors demand to hold long-term bonds over short-term bonds. Larger budget deficits put upward pressure on interest rates, but the CBO also notes that the OBBBA also contributes to this upward pressure by boosting additional demand in the economy.[4]
Conclusion
As noted at the beginning of this policy brief, the CBO’s baseline projections assume no changes to current law. Because Congress frequently revises tax and spending policy, these projections should be understood as contingent rather than certain outcomes. In addition, the baseline reflects conventional scoring assumptions, which do not incorporate separate dynamic scoring adjustments beyond current law. Moreover, it presents primarily point estimates rather than probability ranges, both of which shape how the fiscal outlook is interpreted.
Even with those caveats, the Budget and Economic Outlook provides an indispensable benchmark for evaluating the nation’s fiscal trajectory. Under current law, federal debt, deficits, and interest costs are projected to rise significantly over the coming decade. Without meaningful changes to spending or revenue policy, the United States faces an increasingly strained fiscal position.
Notes
- Unless otherwise noted, all years referencing budget data reflect fiscal years, which begin in October of the previous calendar year and end in September of the calendar year. All years reflecting economic data describe calendar years. ↩
- Total federal debt is equal to intragovernmental debt plus publicly held debt. Intragovernmental debt is simply debt one part of the government owes to another (e.g., Social Security Trust Fund holdings of Treasury bonds). Debt held by the public, by contrast, entails borrowing from private savings and is considered more economically meaningful. ↩
- The Budget and Economic Outlook: 2026 to 2036, 107. ↩
- The Budget and Economic Outlook: 2026 to 2036, 121. ↩