What’s Missing from the Baseline
The Congressional Budget Office’s (CBO) baseline delivers a rigorous projection of the budgetary and economic future as a point estimate - a single number at each moment in time.
Point estimates give scorekeepers and legislators a common reference for assessing the cost of proposed legislation, but prudent budgeting requires more information. Lawmakers need to pay attention to the risks and uncertainty surrounding those numbers as well. CBO provides some information on uncertainty, but the bulk of the 172 pages in the most recent Budget and Economic Outlook focuses more on explaining the point estimates than exploring the probable alternatives.
This brief covers the key sources of uncertainty in CBO’s projections, how financial markets are already pricing it in, and what questions Congress should be asking that the baseline alone cannot answer.
The Baseline Is One Path in a Range of Plausible Paths that Are Relevant for Budgeting.
The baseline is a projection of what will happen to the economy and federal finances assuming current law remains generally unchanged. It is not an oracle into the future.
There are three key sources of uncertainty surrounding the baseline projections.
- First, future events are not known for certain. Undoubtedly, unforeseen events will cause the realized data to differ from current projections.
- Second, model parameters that capture how agents in the economy respond to information are estimated, not known for certain. For instance, how responsive firms are to the tax cuts in One Big Beautiful Bill Act (OBBBA) will influence projections of investment.
- Third, the baseline incorporates future information about the path of policies, but some may not continue as assumed in baseline rules. The rules require projecting certain spending programs to continue, even if they are scheduled to run out of funding or authorization under current law.
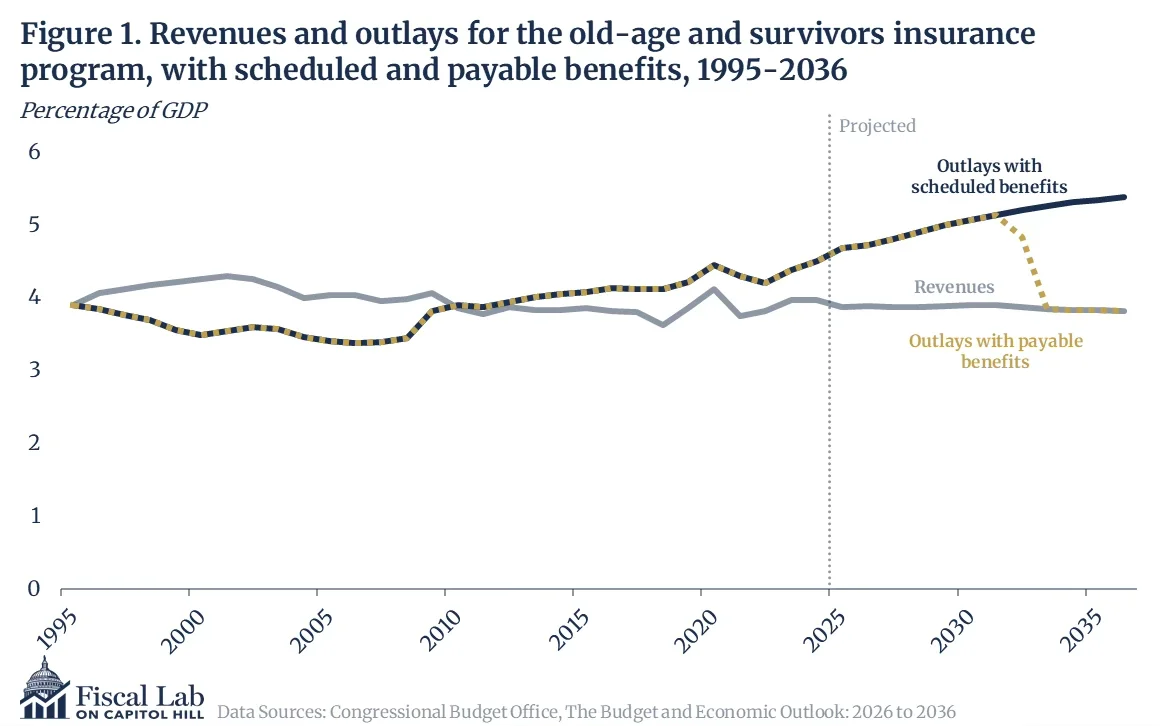
Importantly, the baseline assumes that Social Security outlays continue after the trust fund is exhausted instead of being reduced to equal current revenues (see Figure 1). This has significant implications for the deficit, as outlays for Social Security are about 24 percent of total outlays in the budget window. If the baseline did not have this exception from current law, then outlays would fall by about 28 percent starting in 2032.[1]
The macroeconometric model that CBO uses to project the baseline shows a future that will look approximately like the past.[2] CBO makes adjustments to account for faster investment from the AI boom and slowing population growth, but the future largely continues on the same path. The forecast for real GDP growth shows slightly faster growth in 2026 before returning to the long-run average for most of the budget window.
CBO reports ranges for key economic variables that capture the distribution of uncertainty in their projections. Policymakers should know that these confidence intervals are quite wide. For instance, the 90-percent interval for the growth rate in nominal GDP ranges from 1.8 percent to 6.7 percent. That implies that the cumulative change over 10 years could be an increase between 23.7 percent and 99.0 percent of current GDP, or the difference between $36.9 trillion and 59.6 trillion.
CBO’s projections for real GDP growth imply about a one in three chance of a recession within the next four years, using the shorthand definition of a recession as two quarters of negative real GDP growth.[3] That chance is roughly the same as the average since 1947, where about one in six quarters saw contraction, and higher than the one in 10 average since the start of the Great Moderation in 1984.[4]
The uncertainty bands that CBO plots come from their Markov-switching and BVAR models, which are estimated on past data. What if the future looks radically different from the past? There are two key sources of long-run uncertainty.
- First, the nascent development of artificial intelligence could dramatically reshape the economy. A recent report from the Federal Reserve Bank of Dallas suggests that productivity growth would increase by 0.3 percentage points over the next 10 years.[5] It also recognizes the possibility of two singularities: one where AI generates a positive feedback loop resulting in exponential growth, and another where a negative feedback loop leads to the total extinction of humanity.
- Second, deregulation could raise productivity. CBO’s baseline does not include an assessment of how reducing compliance costs could allow firms to use the same resources to produce more output - the definition of an increase in productivity. Research in this area is limited, but one recent estimate suggests that a regulatory freeze could raise the level of GDP by 1.8 percent after 10 years.[6] Accounting for macroeconomic feedback reduces projected deficits by about 6 percent over 10 years, or between $1.1 trillion and $1.4 trillion.[7]
The Uncertainty Around Budgeting Is Priced in Financial Markets and Significantly Influences the Path of Debt.
CBO estimates that the debt sensitivity of interest rates (DSIR) is 2 basis points for every 1 percentage point increase in the ratio of debt-to-GDP.[8] So debt going from 100 percent of GDP to 120 percent of GDP would add 40 basis points, or 0.40 percent to 10-year rates.
Higher debt is a drag on economic growth.[9] This is because high levels of debt imply future tax increases, inflation, or other fiscal actions to balance the budget. There are two channels through which the implication of higher debt affects economic decisions.
- First, higher debt discourages investment because people expect future tax increases will lower the return on investment.
- Second, uncertainty about how Congress will balance the budget creates risk that discourages investors and business owners from making future economic commitments. Unlike the rules controlling the baseline, investors know that something must change to end unsustainable federal deficits.
If the budget is not balanced through changes to taxation or spending, then the government will eventually resort to printing money. Continued federal deficits raise the prospect of fiscal dominance, where the Federal Reserve cannot contain inflation by raising interest rates because higher rates would just worsen the debt spiral. CBO’s projection expects the Fed to lower interest rates in response to labor market conditions and an improving inflation outlook. If unexpected events cause the actual path to differ from the projection, then the prospects of fiscal dominance matter more.
However, monetary policy responds in part to fiscal policy, and Congress can take action that helps keep interest rates down. Reducing the deficit would reduce inflationary pressure and allow the Federal Reserve to lower interest rates. One estimate suggests that reducing the deficit by 1 percentage point of GDP would reduce interest rates by 25 basis points. By that measure, reaching primary balance, where revenues equal outlays, would bring rates down by 0.5 percentage points.
Congress Should Be Aware of the Risks in the Forecast and Seek Follow-Up Information that Stress Tests the Budget.
In the past 20 years, economists have formalized a concept of “fiscal space.” A government with fiscal space has budgetary room to dedicate resources to a purpose without jeopardizing the sustainability of its finances.[10] A government’s finances become unsustainable when interest costs are so high that no amount of fiscal adjustment could pay down the debt. Estimates of the maximum amount of fiscal space available in the United States vary, but one provided by the IMF suggests the natural debt limit is 160 percent of GDP.[11]
CBO’s estimate of DSIR is related to the erosion of fiscal space. As debt climbs closer to the natural limit, the risk of haircuts[12] or other imposed losses on bondholders rises, which prompts interest rates to rise. However, CBO’s estimate of DSIR is linear, meaning that it is constant and independent of debt. Experience with previous fiscal crises shows that there can be a precipitous tipping point.[13]
Governments with more constrained financing options are more likely to face a sharp fiscal crisis. For instance, Greece during its fiscal crisis in 2012 was constrained in how much it could print money to repay creditors because it had joined the European Monetary Union. However, the United States does not face the same institutional constraints as Greece. The Federal Reserve can always print money to cover federal debt issuance. The cost of doing so would be a resumption of the post-pandemic inflation.
The United States’ ability to print its way out of a debt crisis is in part due to its role as the issuer of the global reserve currency. Demand for the dollar as a reserve currency lowers federal borrowing costs and stabilizes exchange rates.
Increased trade frictions and rising inflation could push other countries away from a dollar standard. The dollar has fallen 9.6 percent in value since its high in January 2025. That shift in exchange rate makes it more expensive for Americans to purchase foreign goods and depresses the return on foreign holdings of federal debt measured against their home currencies. If foreign governments and central banks switch to another currency, that would decrease demand for federal debt and drive up interest rates higher while crowding out capital investment domestically.
The Baseline Is a Starting Point for Budgeting.
Congress receives CBO’s baseline as a forecast, but it should treat the baseline as a starting point for harder questions. The confidence intervals are wide, the tail risks are asymmetric, and the mechanisms that could accelerate debt could turn quickly. A government that exhausts its fiscal space loses the ability to respond to recession, war, or financial crisis without triggering the debt spiral it was trying to avoid. The baseline projects none of this, yet it’s vitally important for Congress to track as it develops this year’s budget.
Notes
- See appendix C in The Budget and Economic Outlook: 2026 to 2036 (Congressional Budget Office, February 11, 2026). ↩
- For more detail on CBO’s model, see Robert W. Arnold, “How CBO Produces Its 10-Year Economic Forecast,” Working Paper No. 2018-02 (Congressional Budget Office, February 2018). ↩
- The one in three figure comes from approximating CBO’s reported percentiles for annual real GDP growth. I assume a normal distribution and find the corresponding distribution for quarterly growth rates. The reported probability of a recession is the rounded chance of drawing 16 quarters from that distribution with two consecutive negative quarterly growth rates. ↩
- Federal Reserve Bank of St. Louis, “Real Gross Domestic Product (GDPC1),” dataset for 1947 - 2025, accessed February 19, 2026. For more on the Great Moderation, see Ben S. Bernanke, “The Great Moderation,” remarks at the Eastern Economic Association, February 20, 2004, Washington, DC. ↩
- Mark A. Wynne and Lillian Derr, “Advances in AI Will Boost Productivity, Living Standards over Time,” Federal Reserve Bank of Dallas, June 24, 2025. ↩
- William Beach and Parker Sheppard, “Reducing Regulations Produces Strong Economic Growth Responses,” Backgrounder No. BG3890, The Heritage Foundation, February 19, 2025. ↩
- William Beach and Parker Sheppard, “Budgetary Effects of a Regulatory Freeze,” Factsheet No. FS281, The Heritage Foundation, April 17, 2025. ↩
- Andre R. Neveu and Jeffrey Schafer, “Revisiting the Relationship Between Debt and Long-Term Interest Rates,” Working Paper 2024-05 (Congressional Budget Office, December 2024). ↩
- For a review of the economic literature on the relationship between public debt and economic growth, see Jack Salmon, “The Impact of Public Debt on Economic Growth: What the Empirical Literature Tells Us,” Mercatus Center at George Mason University, January 7, 2026. ↩
- Peter S. Heller, “Understanding Fiscal Space,” IMF Policy Discussion Paper No. 2005/004 (International Monetary Fund, March 2005). ↩
- Atish R. Ghosh et al., “Fiscal Fatigue, Fiscal Space, and Debt Sustainability in Advanced Economies,” The Economic Journal 123, no. 566 (February 2013): F4 - F30. ↩
- When a government is unable or unwilling to meet its existing debt obligations, it may seek to restructure the debt with its creditors. The haircut refers to the loss in present value of the debt from principal reductions, coupon reductions, or extensions in the maturity of the debt. The losses from the haircuts are borne by the creditors. ↩
- For instance, see Huixin Bi and Nora Traum, “Estimating Fiscal Limits: The Case of Greece,” Journal of Applied Econometrics 29, no. 7 (November/December 2014): 1053 - 1072. ↩