The Fiscal Lab Jobs Report for August 2026


A Ray of Sunshine
- Nonfarm payroll employment rose by 162,000 jobs in August 2026.
- The BLS revised prior months upward: June to 31,000 (+11,000) and July to 21,000 (up 44,000 from an initial −23,000).
- Manufacturing employment is showing more growth than the long downward trend of recent decades would predict.
- The labor force participation rate improved modestly, though not by enough to be statistically significant for the month.
- Nonfarm payrolls rose by 162,000 in August, roughly three times the 55,000 economists expected.
- BLS revised June and July upward, lifting July from -23,000 to 21,000.
- Unemployment held at 4.1 percent, and manufacturing employment has added 56,000 jobs this year.
The Bureau of Labor Statistics (BLS) gave its new Commissioner of Labor Statistics, Dr. Brett Matsumoto, some good news at the end of his first month on the job. As shown in Figure 1, nonfarm payroll employment rose by 162,000 jobs in August. Economists had expected about 55,000 jobs. Of that total, private sector employment increased by 127,000. The government sector, which added a total of 35,000 jobs in August, grew principally from increases in local government employment (50,000), of which local government education rose by 41,900. Employment in the federal government continued to shrink: -5,000 for the month.
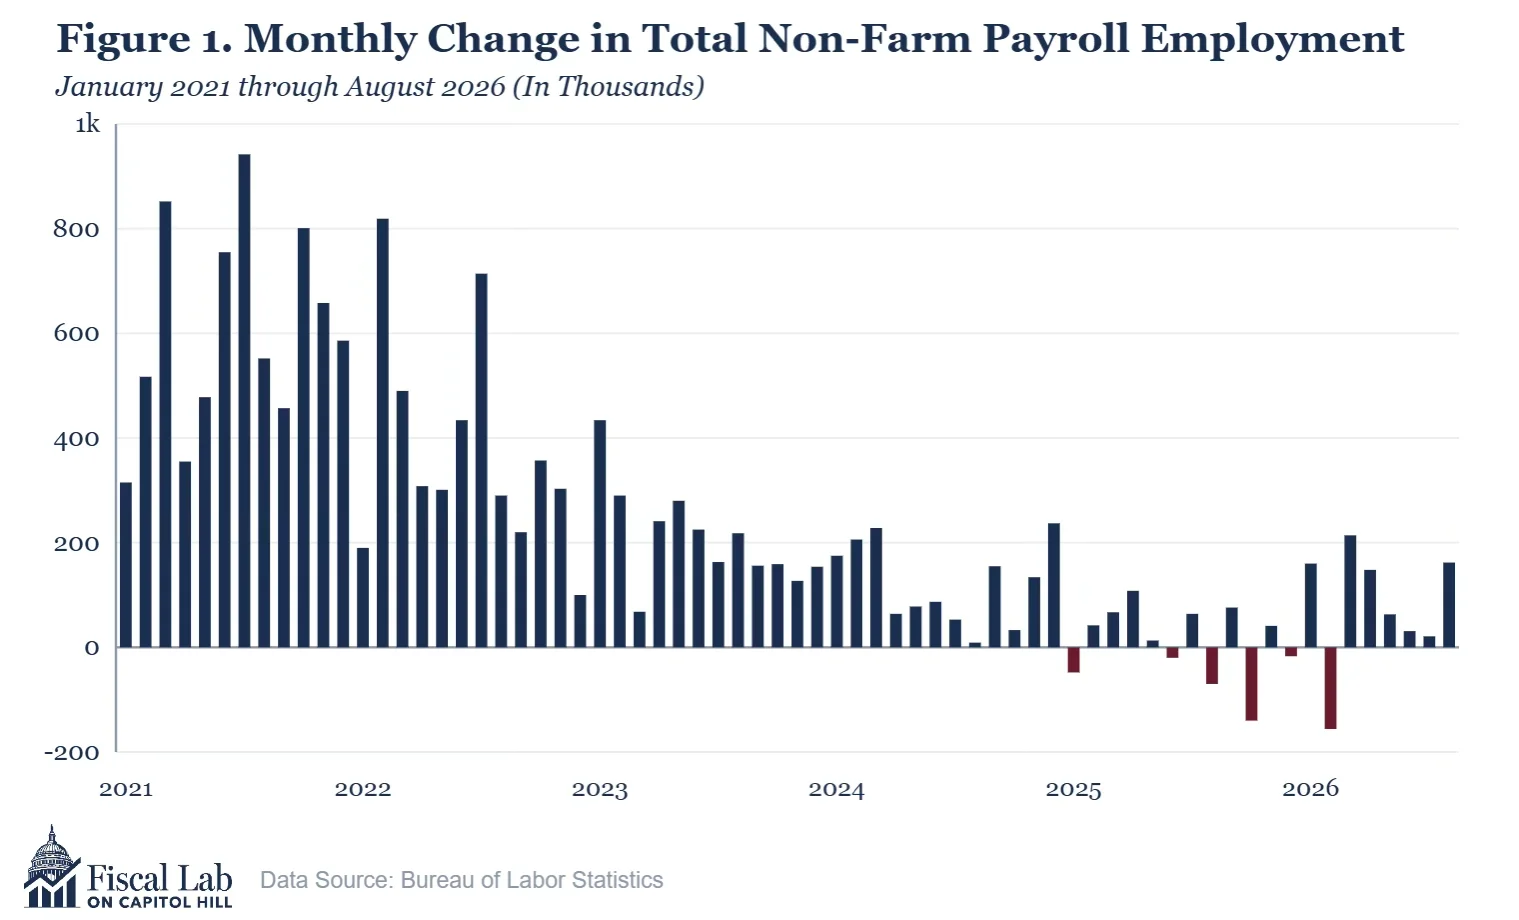
BLS gave us more good news by revising upwards its estimates for July and June. The June estimate rose by 11,000 to 31,000, and the surprisingly negative number for July (-23,000) rose by 44,000 and now stands at 21,000. The July estimate is subject to one more revision.
Even manufacturing employment is starting to look brighter. Many policymakers and analysts have kept a very sharp focus on manufacturing jobs. This sector has been especially buffeted by 40 years of off-shoring and technological change that significantly reduced total employment in durable and nondurable manufacturing. While domestic output remained strong over this period, total manufacturing jobs dropped from a post-war high of 19,509,000 in May of 1979 to last month’s estimate of 12,638,000 (or a decrease of 35 percent). More telling is the decline in manufacturing jobs as a percent of total employment: from 22 percent of total nonfarm jobs in 1979 to 8 percent today. Efforts, like President Trump’s tariff initiatives, are being made to rebuild jobs in this sector.
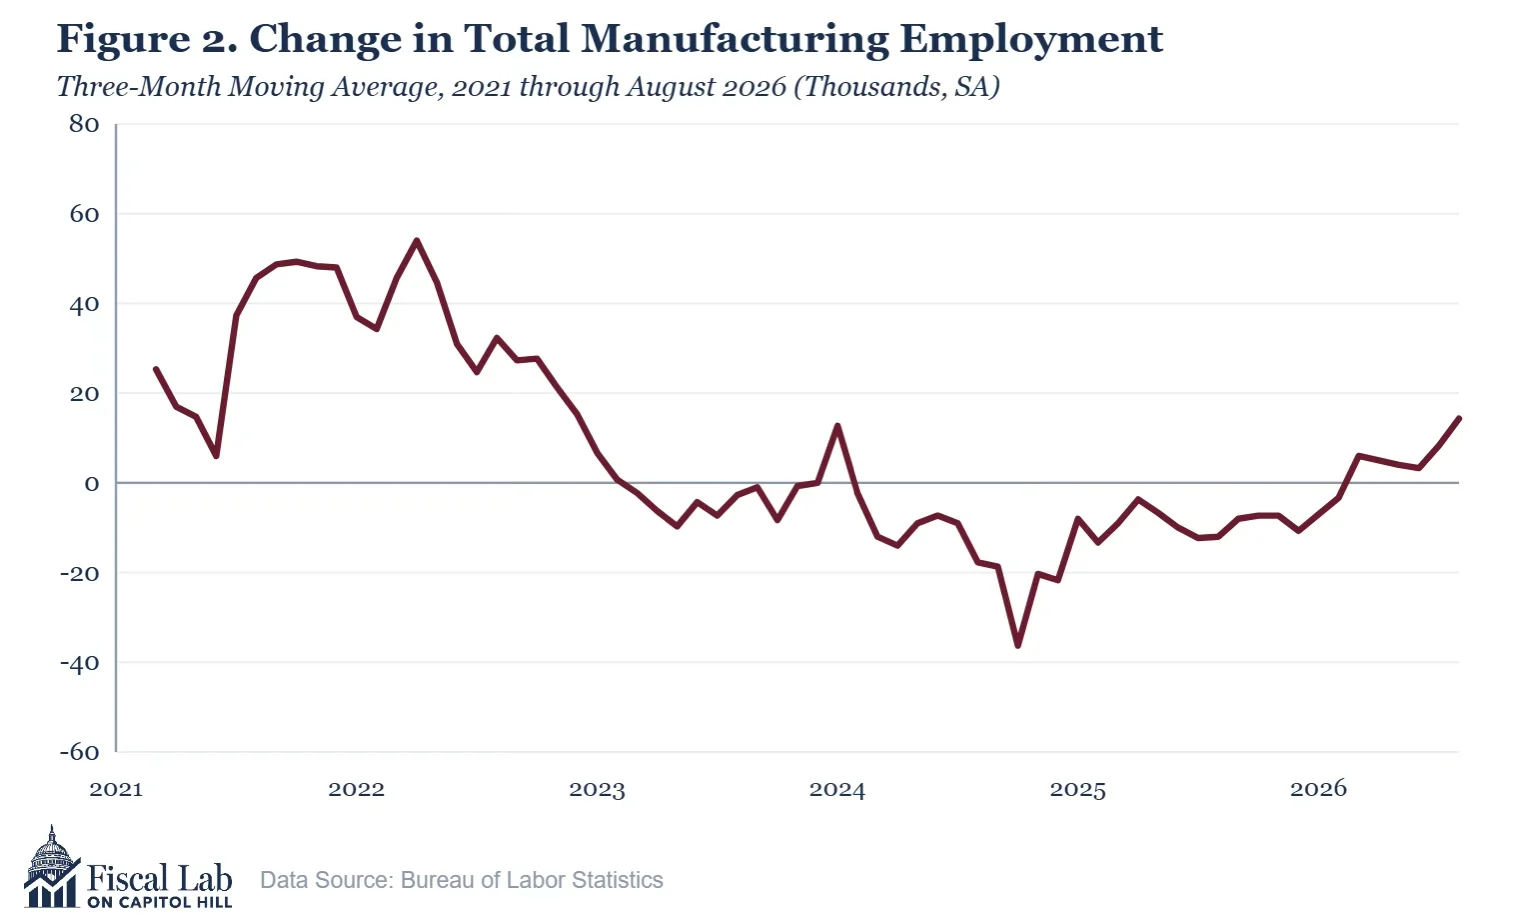
As they say in the law business, the jury is still out on this initiative. Even so, recent data indicates much more employment growth in manufacturing than one would expect just by observing the downward trend of the past several decades. This sector grew by only 35,000 between January of 2025 and last month, principally because of job declines in 2025. However, manufacturing jobs have increased by 56,000 this year. Figure 2 shows the three-month moving average of employment change in this sector.
These sunnier results from BLS’s survey of businesses (the Current Employment Statistics survey produces nonfarm employment estimates) were reflected in the relatively positive results from the household survey (the Current Population Survey provides estimates of unemployment and the labor force). The headline unemployment rate remained unchanged from its July reading at 4.1 percent, as shown in Figure 3.
That said, the total number of unemployed rose, month over month, by 115,000 (though that increase is within the survey margin of error, thus not statistically significant). This population, however, has increased over a six-month period by a statistically significant 457,000. Thus, policymakers still need to be sharply focused on 7,031,000 people who are looking for work but remain jobless.[1]
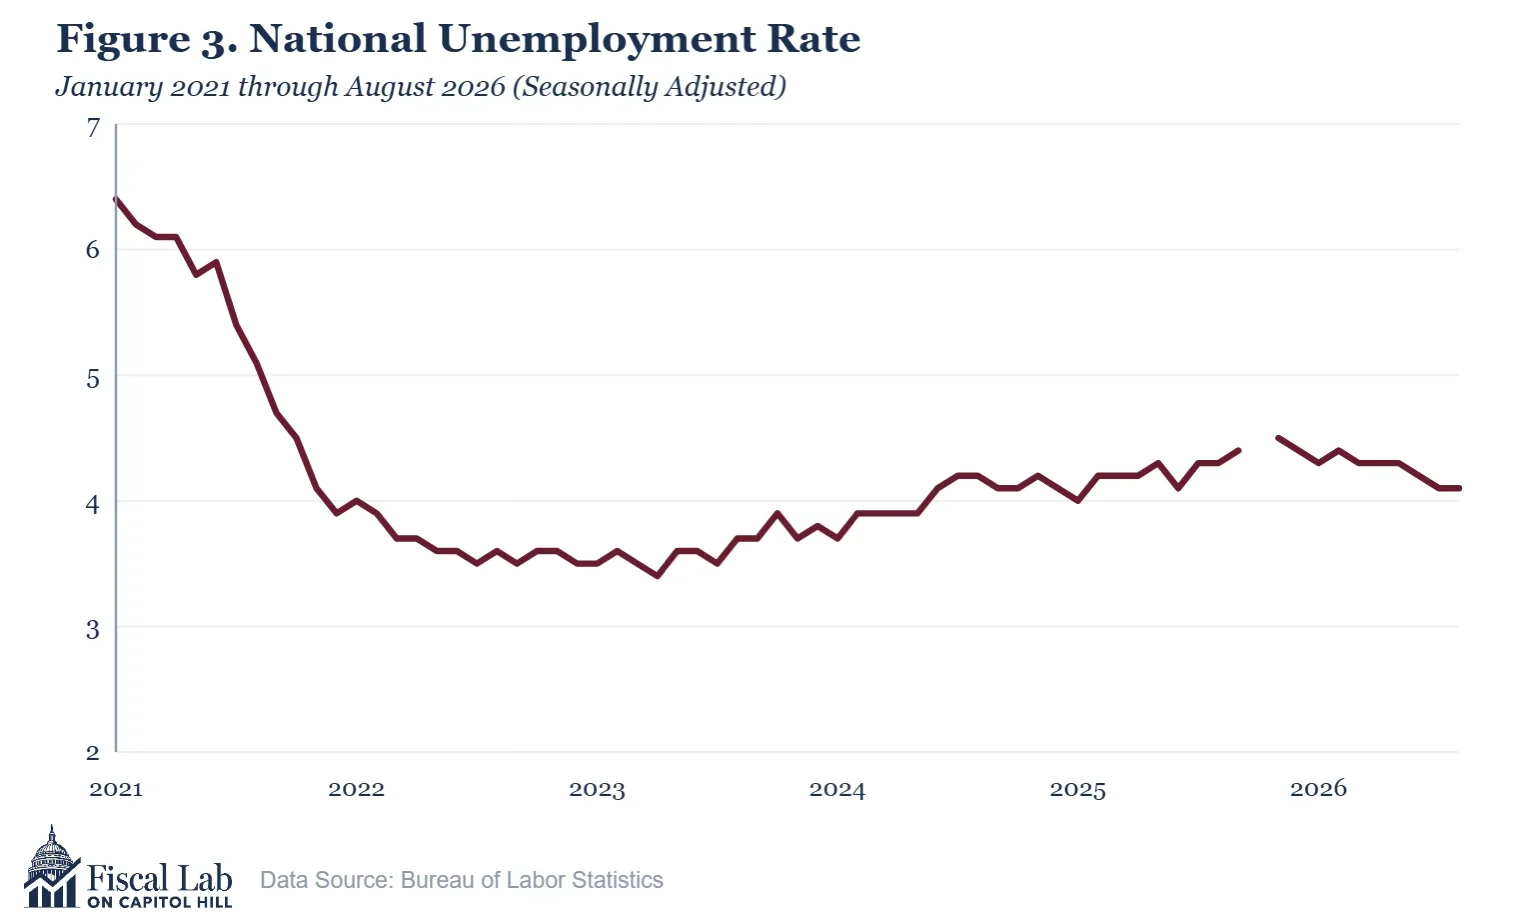
The unemployment rate arrayed across sex, educational attainment, age, race, and ethnicity mostly changed very little. However, seasonally adjusted teenage unemployment rose by 2 percentage points, and unemployment among Asian workers dropped. Overall, the unemployment picture at 4.1 percent, while still showing elevated rates from the 3.0 percent level desired by many policymakers, appears to be improving.
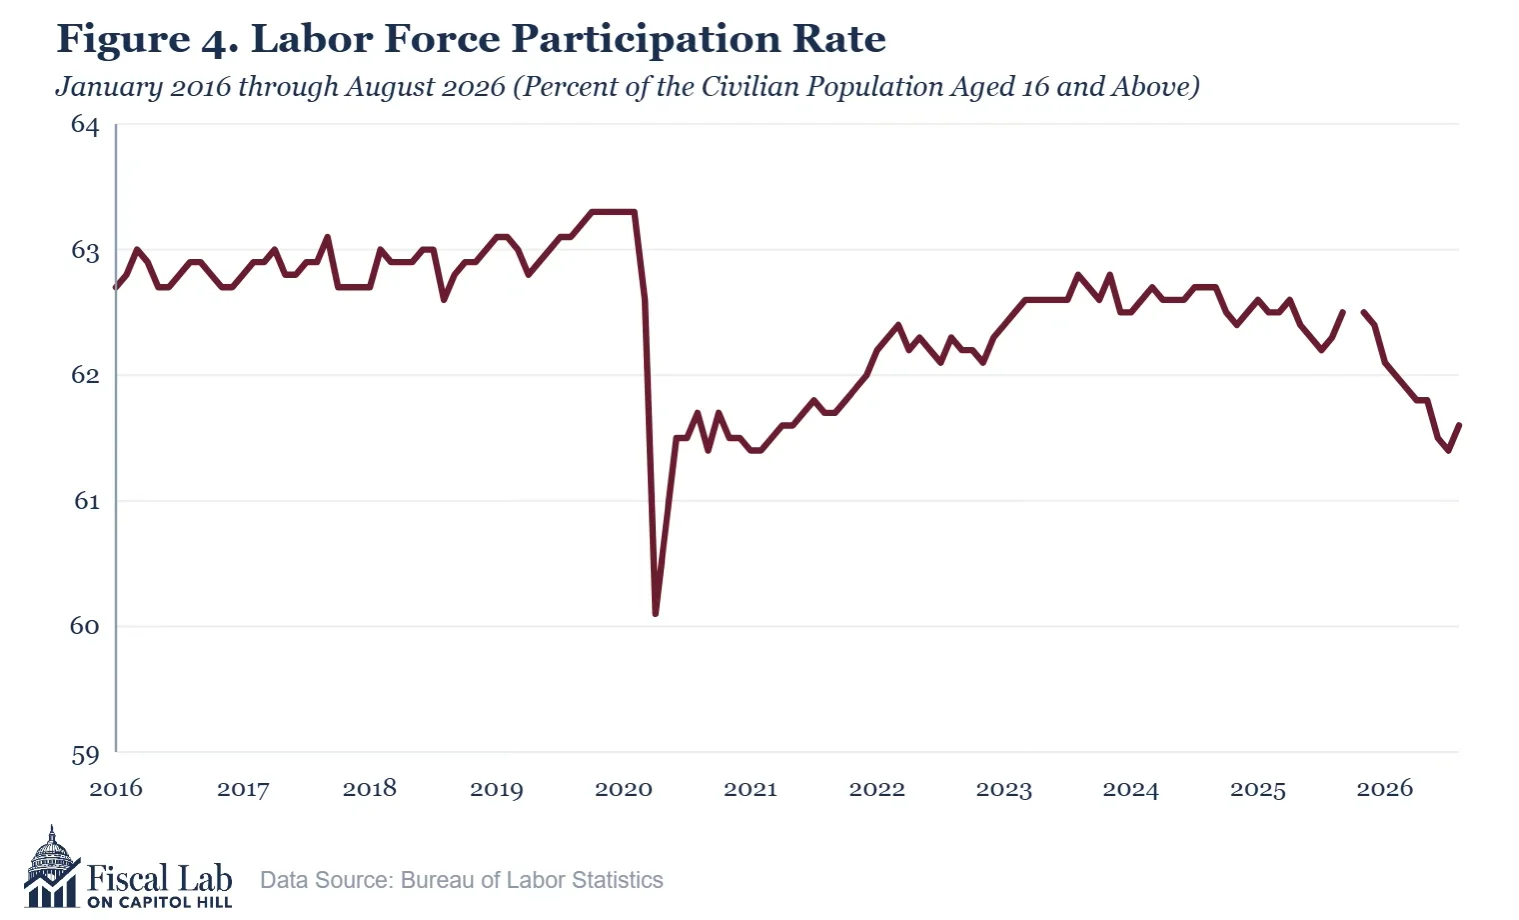
Likewise, the labor force participation rate showed some improvement (though not so much as to make the monthly result statistically significant). This labor force metric is getting almost as much attention as the unemployment rate, given the long decline in participation across nearly all demographic segments. “Participation” means that a person 16 years and older either worked or looked for work during the four weeks prior to the survey period (usually the middle of the month). The reason for this focus is evident in Figure 4 below, which shows the relatively sharp decline in the participation rate. Perhaps the August result marks a turning point.
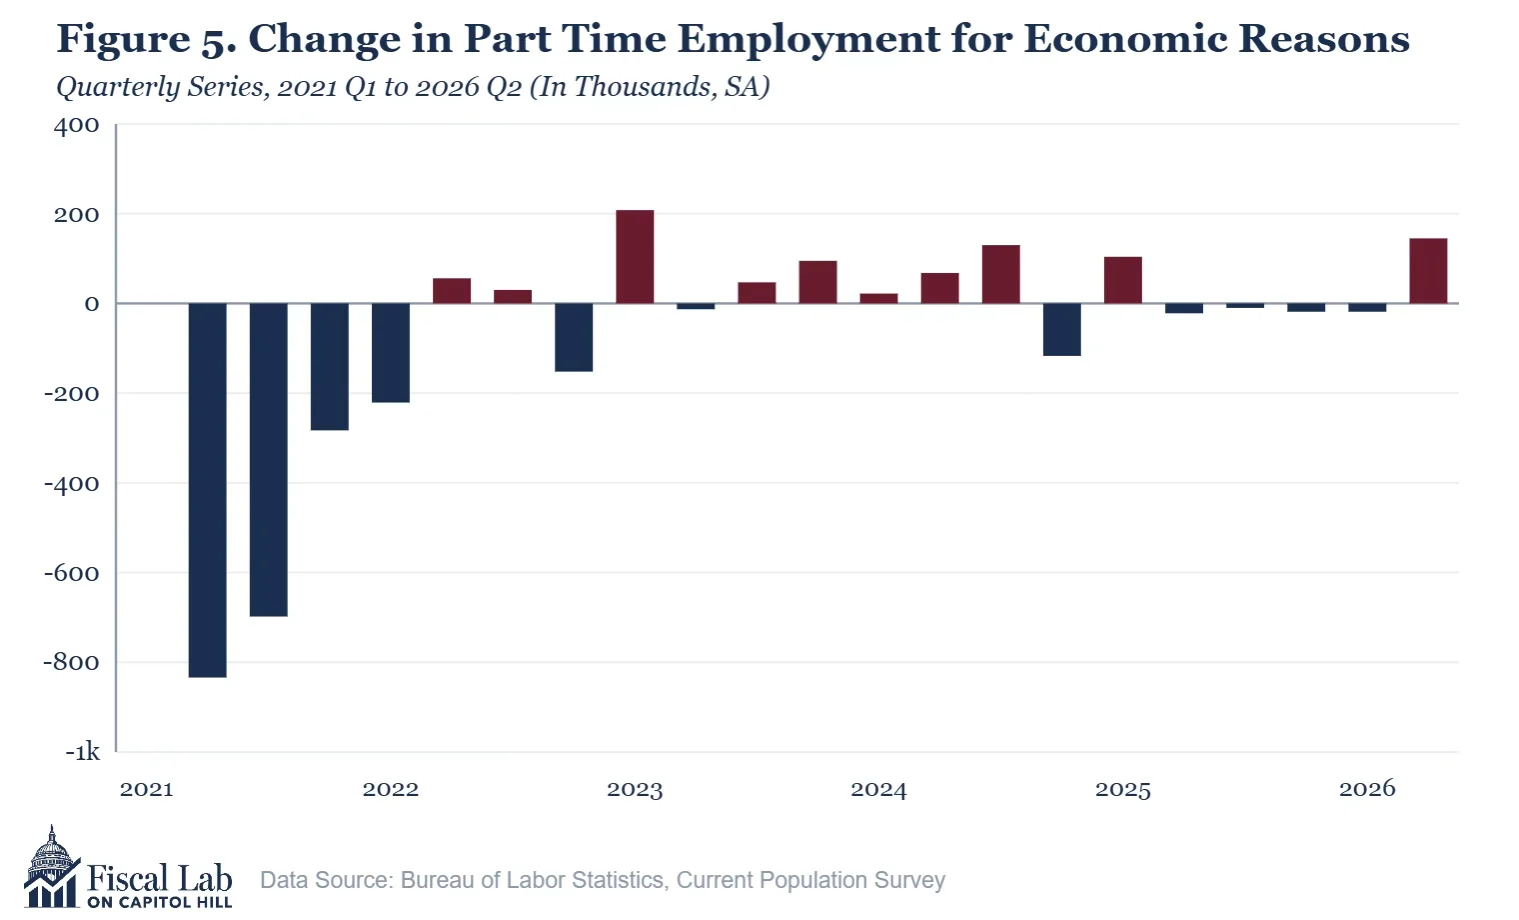
Finally, one metric to which watchers of the economy should always attend is the relatively obscure “part time for economic reasons.” This statistic is an estimate of the number of workers who would like full-time work but only can find part time due to a compulsory reduction in their hours or because full-time jobs are not available for them. This metric tends to grow when the economy begins to slow and move in the opposite direction when the pace of economic activity quickens. It also is never zero, since some firms need to reduce hours or only offer part-time work even in great economic times. True to this leading indicator status, the number of people working part time for economic reasons has declined sharply from the stressful days of post-Covid inflation, or 2021–2023.
Figure 5 below shows the change in the number of workers who have a part-time job for economic reasons. Thus, a negative number on the chart indicates fewer part-time workers and a positive number more. These data are quarterly estimates from the first quarter of 2021 through the second quarter of 2026. Note that the total number of workers in this category shrinks significantly between 2021 and 2023, as the economy recovered. It since has shown little directional change. That said, the last month and the last quarter show statistically significant increases. This statistic may be something to watch.
Despite a couple of dark clouds, the jobs report for August 2026 arrives with more good news than many that preceded it. If the employment scene continues strong over the next several months, then we may be excused in saying that the US economy is amazing, given the many hurdles it must overcome today. Despite war, inflation, political discord, and financial markets buffeted by the federal government’s fiscal crisis, our economy still manages to grow and provide employment for millions of workers at modestly increasing salaries and wages.
As always, we need to see what data revisions hold. Even so, today’s news deserves a sunny headline.
Notes
- The total number of unemployed has risen by 444,000 over the past 12 months. ↩