The Fiscal Lab Jobs Report for May 2026


The Bureau of Labor Statistics (BLS) jobs report for May shows a strengthening labor market, despite the headwinds coming from the hostilities with Iran and the worsening expectations of US consumers.[1] Nonfarm payrolls grew by a stunning 172,000 in May, which is well above the consensus forecast of 88,000. Private payrolls increased by 120,000, which were complemented by a strong showing in state and local government growth (primarily in education) of 50,000. The unemployment rate held steady at 4.3 percent, which reflected an equally strong showing in the other metrics of the Household Survey.
Job Gains Were Widespread
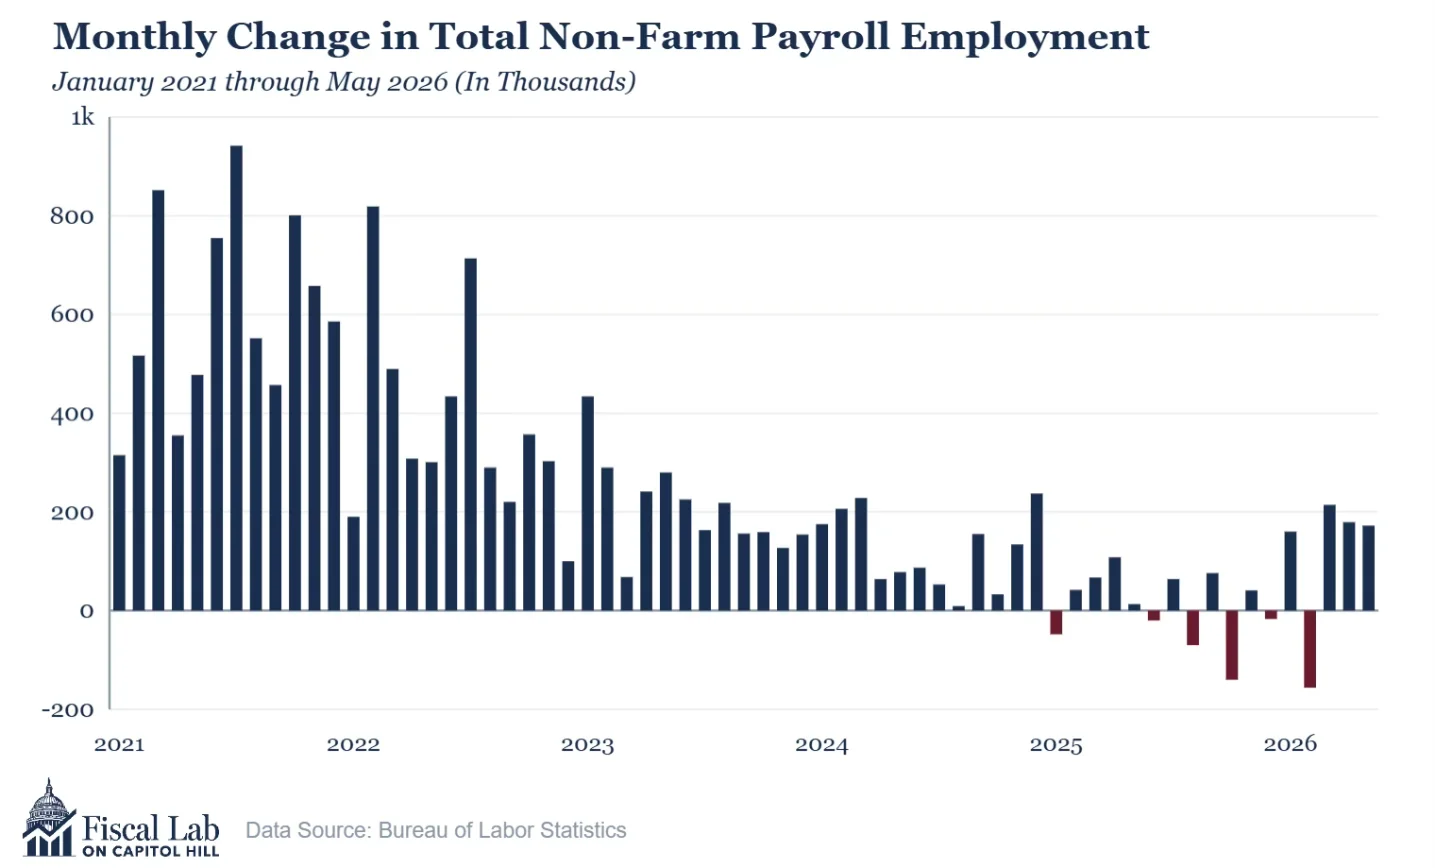
The upward revisions in the March and April jobs estimates make the May estimate look even stronger. BLS revised its March estimate by an additional 29,000 from 185,000 to 214,000; and it moved up its estimate for April by 64,000 from 115,000 to 179,000. These revisions reflect additional survey data received by BLS after the Bureau made its first estimate. Unlike many of the months in 2025, when additional data led to downward revisions, this series of upward changes further support the impression of a stronger labor market.
Most of the key sectors showed growth. The goods producing industries expanded by a total of 28,000 jobs, with construction and durable goods manufacturing adding 17,000 positions each. The service-producing sector grew by 92,000. Inside services, leisure, and hospitality services grew by 70,000, closely followed by an increase in healthcare and social services of 47,200 jobs.
One note of caution on these otherwise excellent nonfarm payroll numbers today: Average hourly earnings grew at an annual rate of 3.4 percent, which is below the overall inflation rate of 3.8 percent. In fact, the growth in the annualized, seasonally adjusted hourly earnings is the lowest it has been since the recovery from the pandemic. While this means that, on average, workers’ pay is not keeping pace with inflation, it will be interpreted by monetary authorities as a sign that wage pressures are not the cause of the current elevated price level.
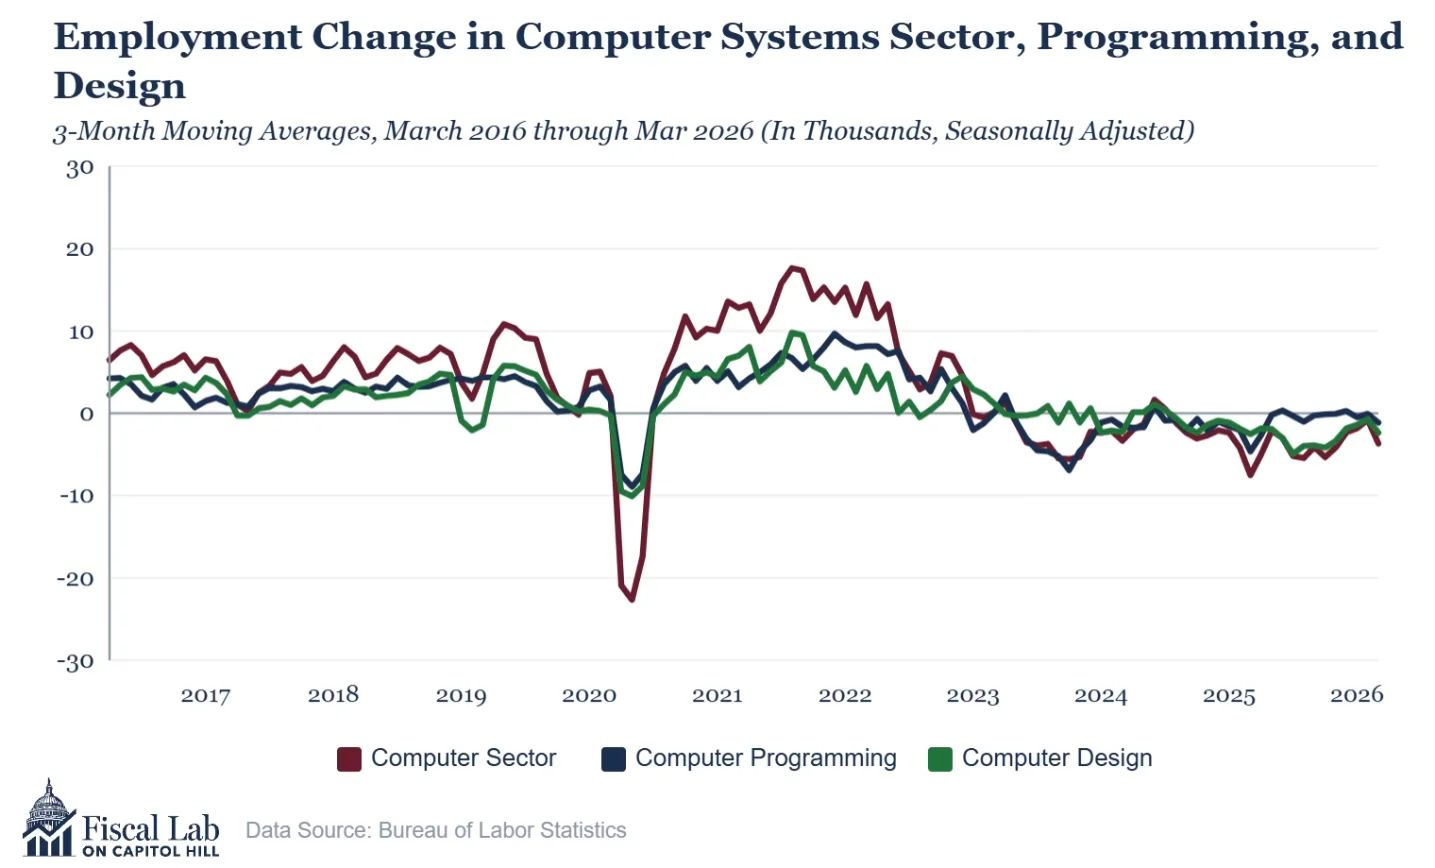
We have been closely watching in previous reports[2] the effects of AI on key service sectors, particularly in computing and financial services. Both are experiencing significant job disruption due to the implementation of AI capabilities. For example, AI software now completes a good deal of routine coding and computer design project work, which has, in part, caused hiring declines in the larger professional and business services sector in which computer-related employment is classified. What’s happening in the computer sector could be a laboratory experiment for AI’s effects on the larger economy. Economists who follow AI are keenly interested in the net effect of AI transformation: Will it result in steadily declining employment as AI replaces human workers, or will the transformation ultimately lead to more employment as workers retool to work differently in an AI environment?
The graphic below looks at employment change in the computer sector. Note that a “plateau” of job change appears to be forming. We will continue to monitor employment developments in this sector.
Unemployment Held Steady in May
Some observers might view the demographic side of this month’s jobs report as profoundly uninteresting: After all, none of the key labor force estimates changed from their April levels. However, there is nothing boring about no change in the headline Household Survey results. If anything, those unchanged results further support the view of a labor market strengthening.
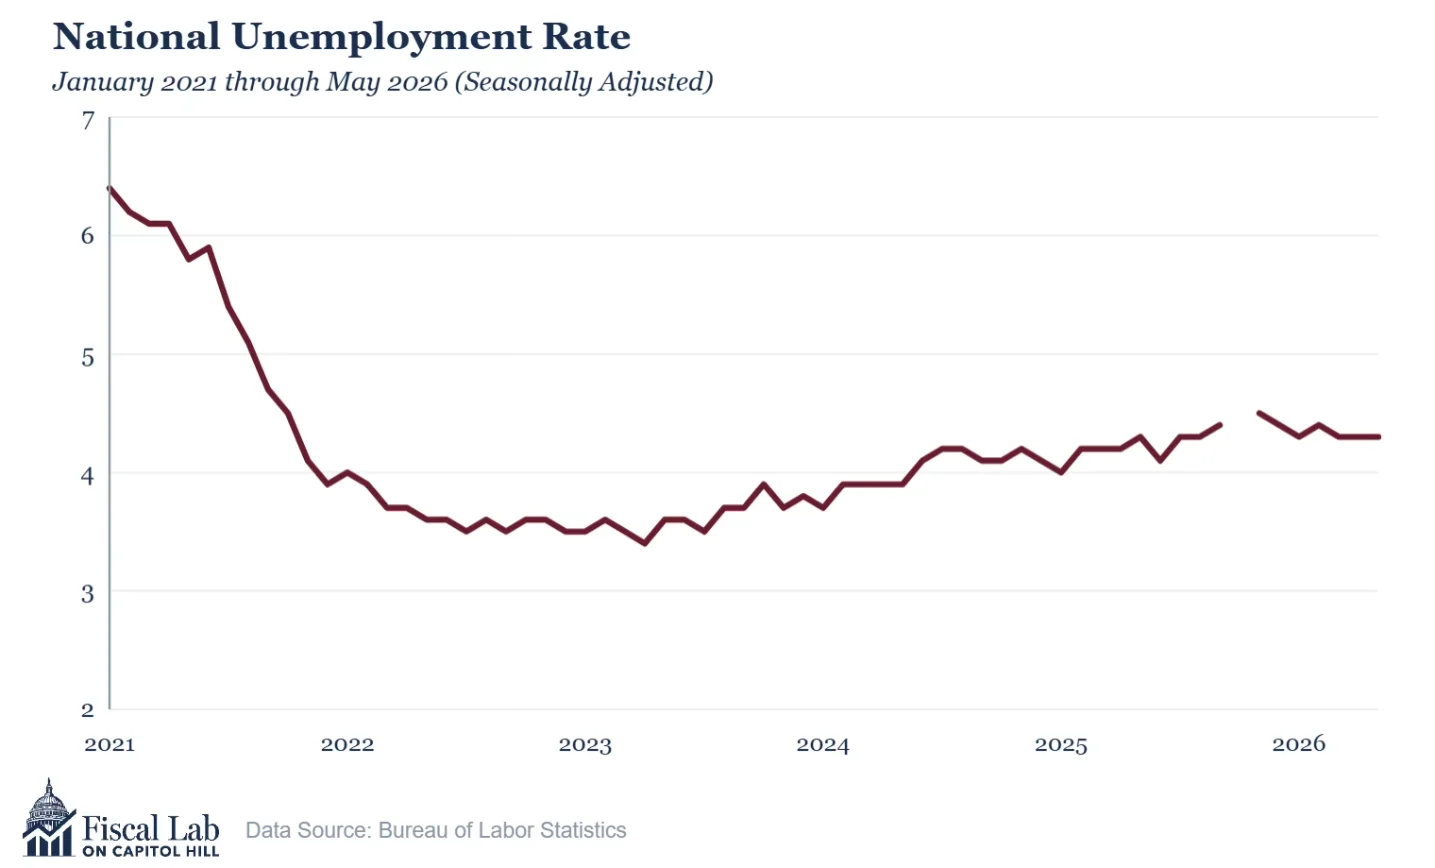
The principal unemployment rate, U3, remained unchanged in May at 4.3 percent.[3] While elevated over the “normal” rate of 3.0 percent (a rate that accounts for typical employment separations and other recurring job events), it did not increase as it had for much of the period 2023 through 2025. Indeed, none of the major labor force indicators changed significantly.[4]
While the month-over-month estimates remained constant, there are some significant movements in the latest three-month period (May over February of 2026). For instance, the bell-weather metric of “part-time for economic reasons” is higher in May than in February. This statistically significant result largely is due to workers whose hours have been reduced due to slack demand for their products. Also up is the number of discouraged workers, or those who would like to work but have given up looking for employment in the past year. These two negative indicators should alert policymakers to possible weakness in an otherwise strong labor market.
A further yellow signal on labor market health is found in a little reported product of the Household Survey: the unemployment rates by occupation and industry. BLS asks households about their jobs and then classifies these responses into occupational and industrial categories. The table below shows the change in occupational unemployment rates from May 2025 through May 2026. Note that several categories are slightly up May over May, but the pattern is mixed and has improved over previous months.
Unemployment Rates by Occupation and Industry
| |||
|---|---|---|---|
| (Not Seasonally Adjusted) | |||
| May 2025 | May 2026 | Change | |
| Occupation | |||
| Management, professional and related occupations | 2.4 | 2.5 | 0.1 |
| Service occupations | 4.8 | 5.0 | 0.2 |
| Natural resources, construction, and maintenance | 3.8 | 4.2 | 0.4 |
| Production occupations | 4.6 | 3.6 | -1.0 |
| Industry | |||
| Construction | 3.5 | 4.1 | 0.6 |
| Manufacturing | 3.6 | 3.1 | -0.5 |
| Wholesale and retail trade | 5.1 | 4.2 | -0.9 |
| Financial activities | 2.7 | 2.2 | -0.5 |
| Professional and business services | 3.4 | 3.7 | 0.3 |
| Education and health services | 2.7 | 3.5 | 0.8 |
| Leisure and hospitality | 6.4 | 5.8 | -0.6 |
| Government | 2.0 | 2.4 | 0.4 |
| Self-employed, unpaid, family workers | 3.1 | 3.1 | 0.0 |
The Bottom Line
BLS’s survey results can be affected by a wide array of factors, from nonresponse by key businesses to sudden demographic changes (think immigration policies) that affect the populations from which the survey sample is drawn. Thus, students of the BLS jobs report know that sudden changes in levels and rates can occur.
However, they also know to watch the trend lines of key labor market indicators. What they are seeing in the last several months are stronger results: The unemployment rate is stalling, and nonfarm employment gains have exceeded modeling forecasts; revisions are more positive than negative, and sector results do not indicate major weaknesses.
Policymakers will likely see these trends as something more than a temporary pause in what was a worrisome economic picture. Now they should take the time to ponder what factors under their control produced this seemingly happy set of results.
Notes
- See the latest Survey of Consumers from the University of Michigan. The consumer confidence index now stands at its lowest level since June of 2022. See sca.isr.umich.edu. Also note that the closing of the Strait of Hormuz is apparently stressing US capital markets. See apollo.com. ↩
- My previous monthly jobs reports were published by the Economic Policy Innovation Center (EPIC), which ceased operations in early June 2026. However, those reports remain available on the EPIC website at epicforamerica.org. ↩
- Note that no labor force data were collected for October 2025 due to a partial government shutdown. See the interrupted line in the unemployment graph below. ↩
- Readers who want to dive more deeply into statistically significant changes to the labor force estimates would do well to bookmark this monthly BLS table: “Statistical Summary Table: Changes in Selected Labor Force Indicators with a Statistical Significance Test at the 90% Confidence Level” at bls.gov/web/empsit/cpssigsuma.htm. ↩