The Fiscal Lab Jobs Report for July 2026


Overview of the July Employment Situation Report
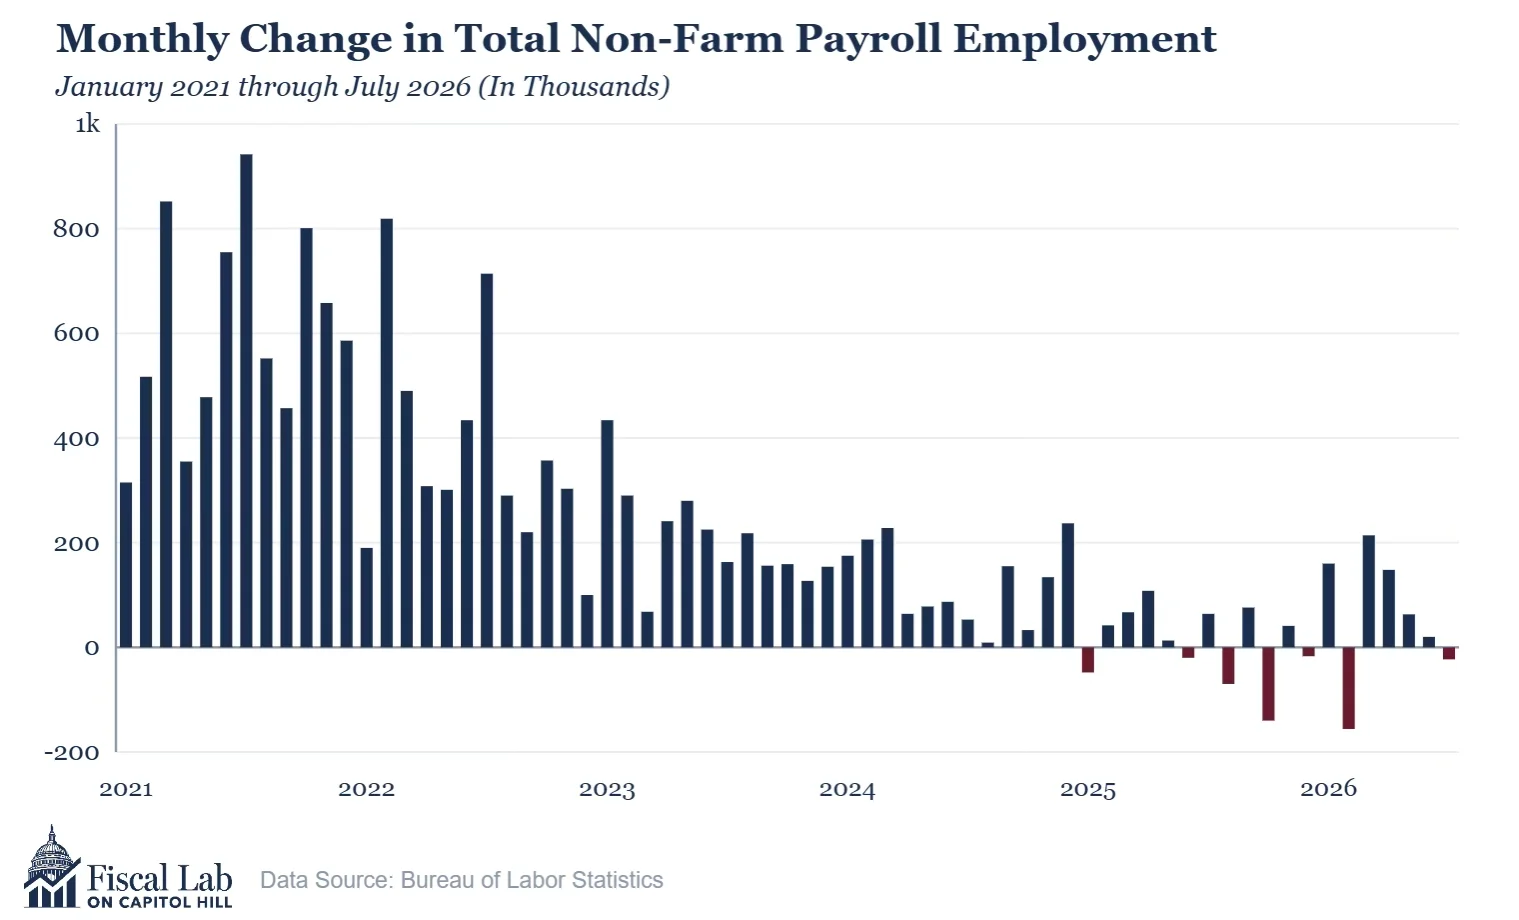
The Bureau of Labor Statistics (BLS) released its Employment Situation report for July on August 7, and the headlines were all about the drop in job growth from June to July: total nonfarm payrolls declined by 23,000. No doubt this estimate will be revised in the coming two months,[1] but for the moment the initial estimate gives further weight to concerns about slow employment growth in what otherwise looks like a plain-vanilla economy…nothing dramatic, just steady growth.
Indeed, the goods-producing side of the economy had a solid month. Total employment there grew by 25,000 in July and by 42,000 since May. Construction led the sector with a 22,000-job gain last month, no doubt due in large part to the data center construction boom. Overall, the private side of the economy (goods plus services) grew by 30,000, with healthcare once again adding the majority of jobs. What produced the negative in July was a 53,000 decline in government, with local government education falling by 49,600.
A Look Behind the Headlines
The real headline, however, should be focused on two sets of numbers that often do not get the attention they deserve: downward revisions and slowing in labor force growth.
First, BLS significantly reduced its jobs estimates for May and June. BLS dropped the May estimate by 66,000 from 129,000 to 63,000 and reduced the June estimate by 37,000 from 57,000 to 20,000. The May estimate is now final until the annual benchmarking exercise is published in early 2027, and the June estimate can be revised one more time. These reductions are much better evidence of slow job growth.
Second, the labor force has been declining sharply over the past six months. BLS reports that the civilian labor force has declined by 1,371,000 since February. This drop no doubt stems from two sources: the steady and large increases in retirements and changes in immigration. BLS estimates that the category “not in the labor force” grew by 1,978,000 since February, and retirements would likely be in that group. The other source is the dramatic decline in inward migration and the substantial slowdown in processing the visas that permit foreign migrants to work in the US. Here are some highlights:
- Refugee admissions are at a record low year-to-date.
- The issuance of immigrant visas has declined by 21 percent this year.
- Green card issuances have declined by 1.32 million since fiscal year 2025.
- Nonimmigrant visas are down by 11 percent since September of 2024.
- And, perhaps most importantly, there is an unprecedented backlog in processing immigrant cases (up 17 percent over the prior year).[2]
In short, the labor inflow from other countries has been dramatically and intentionally curtailed.
Another worrying aspect of recent labor force data is the statistically significant decline in the labor force participation rate. This rate measures the percentage of the noninstitutionalized civilian population that either is working or has looked for work in the past four weeks. The current estimate of this rate is 61.4 percent, which is down from its year-ago setting of 62.2 percent, or a drop of 0.82 percentage points. Over the past six months, however, the participation rate has dropped by 0.63 percentage points, or nearly 80 percent of its annual decline.
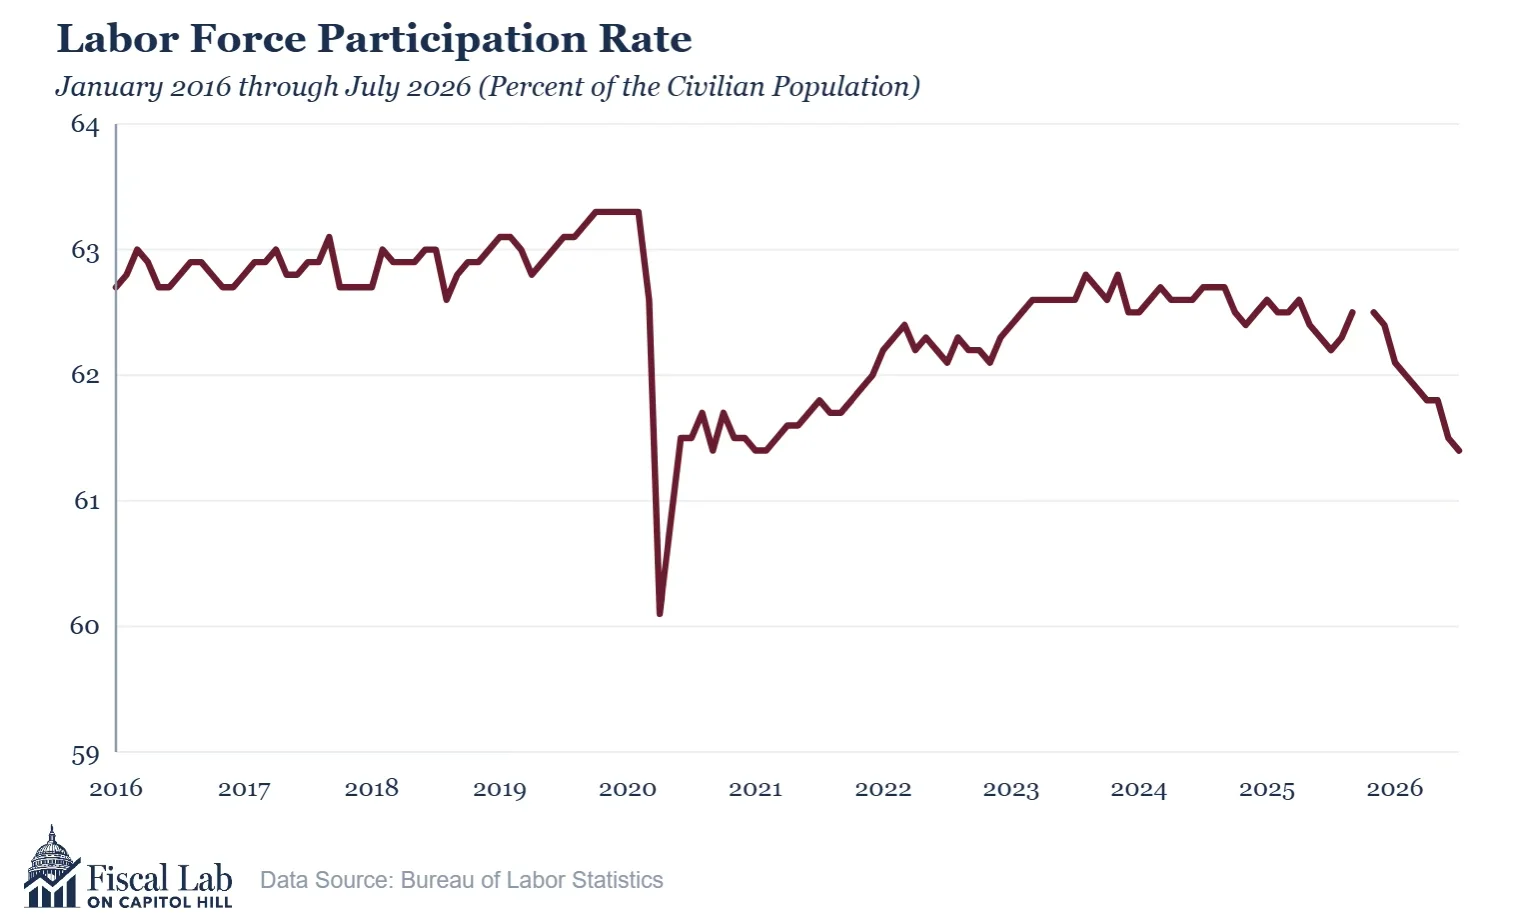
Numerous explanations have been offered for the decline in participation, from the obvious increase in retirements to a generational shift away from steady, full-time work. Whatever the cause, the decline means that those who continue to participate need to be achieving ever greater levels of productivity to ensure growth in the nation’s standard of living.
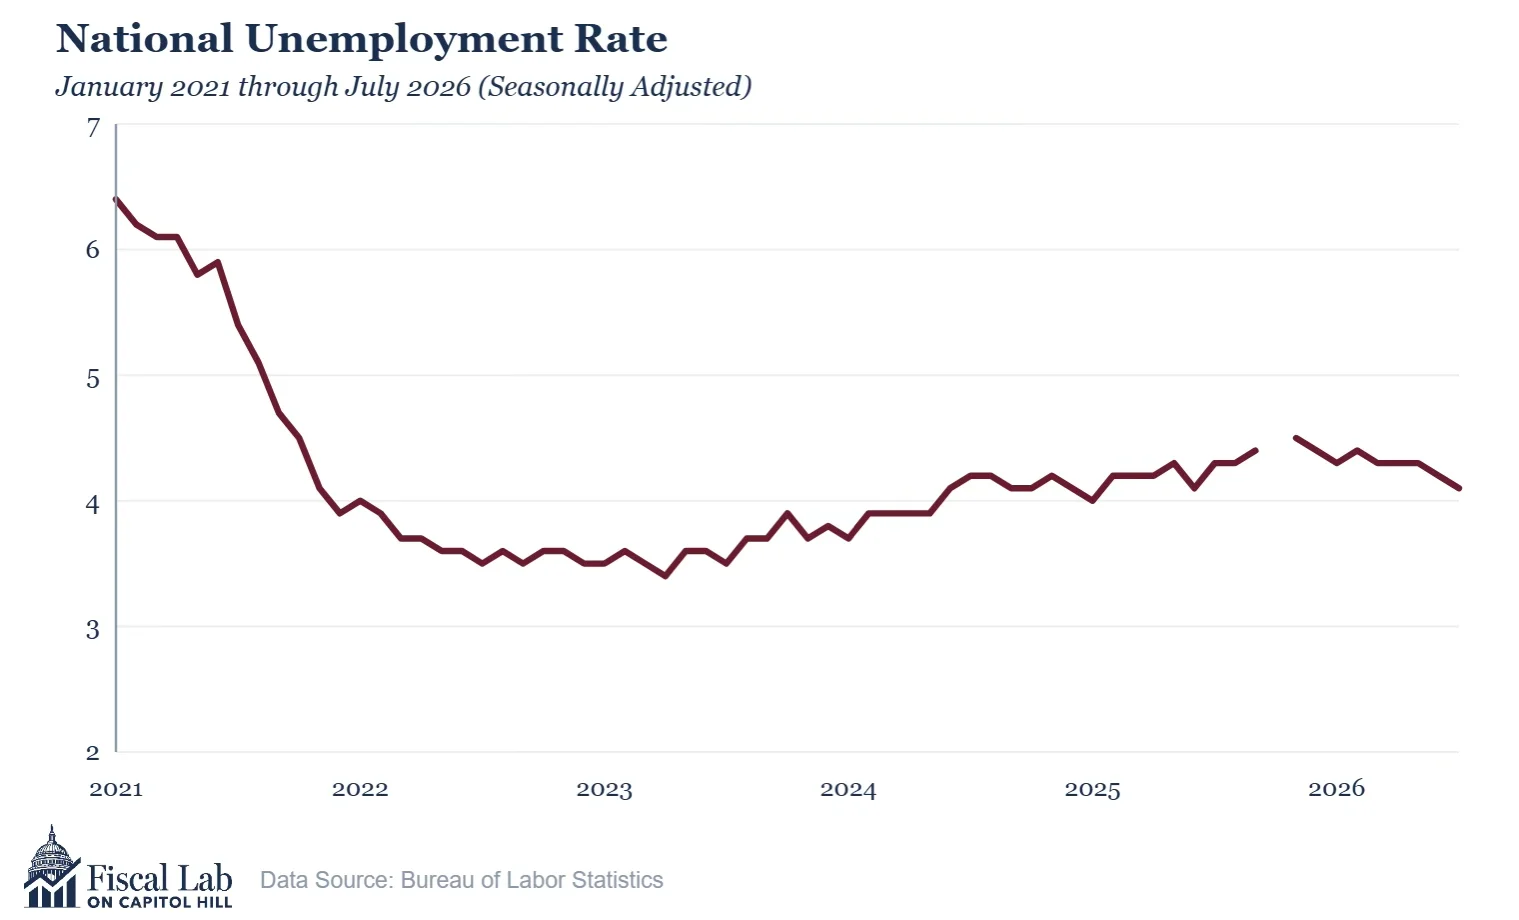
This seepage in labor force participation may be a contributing factor to the steady decline in the unemployment rate.[3] The unemployment rate dropped in July, from 4.2 to 4.1 percent, but that was not statistically significant. Indeed, the rate has slowly declined from its recent high of 4.5 percent in November of 2025. While growth in the labor force is slowing, the decline in the participation rate may also mean a drop in the number of people looking for work.
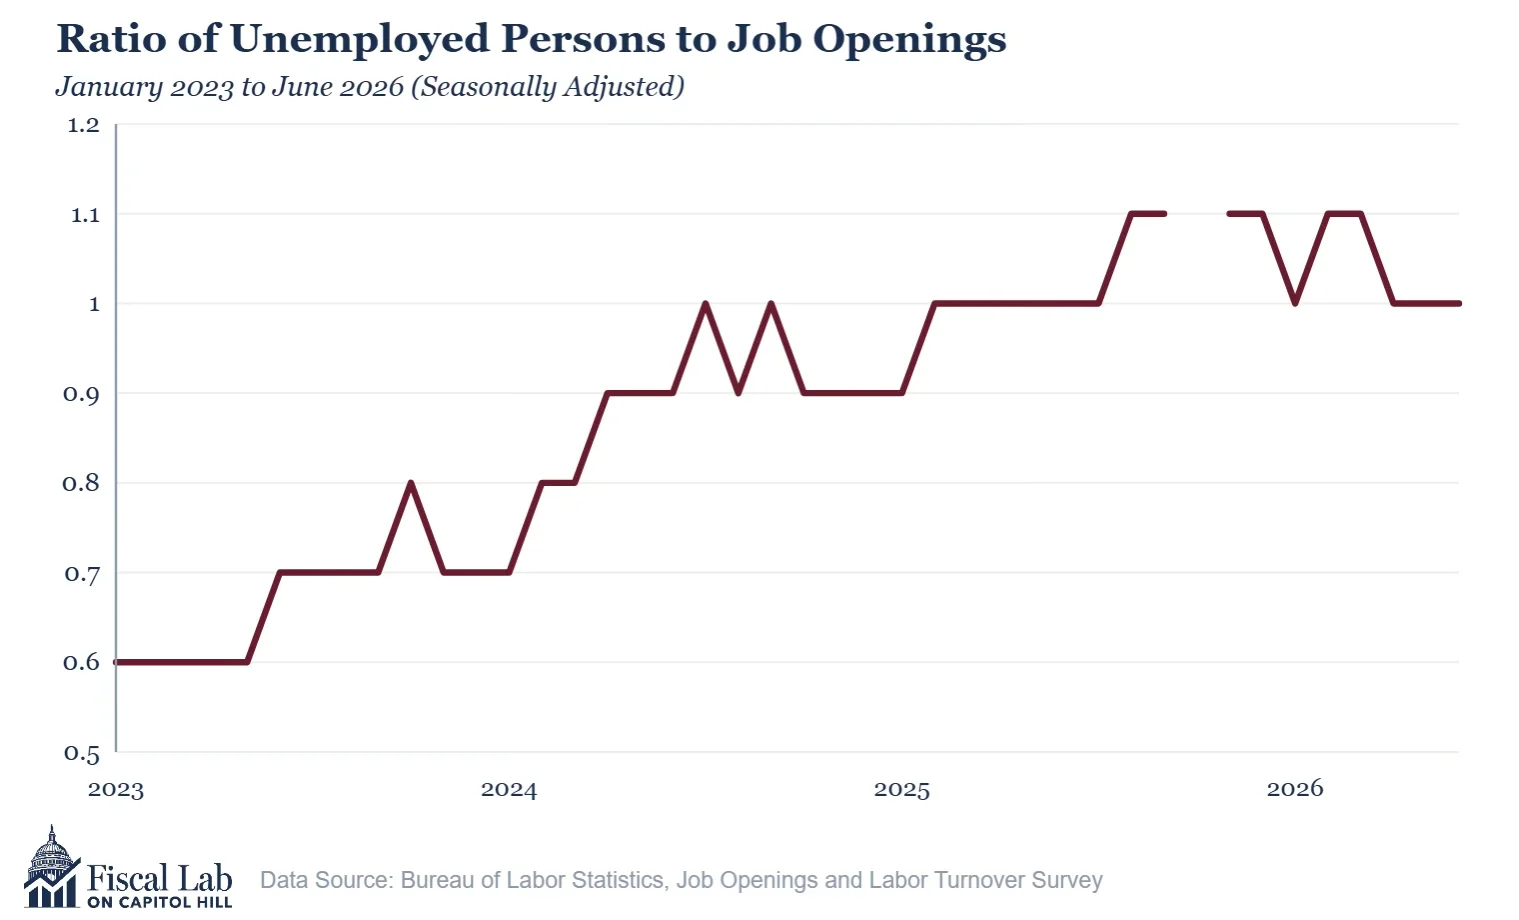
However, one might argue that the slight drop in the unemployment rate stems from renewed vigor from the demand side of the job market. That is, slower labor growth may mean more job opportunities for those looking for work. The most recent data, however, do not support that argument. While the demand side of the job market continues to show strength, and employers do have more jobs they would like to fill now as compared to this time last year, hiring is statistically flat, year-over-year. Indeed, BLS’s most recent Job Openings and Labor Turnover Survey (JOLTS) shows a steady rise in the ratio of unemployed people per job opening.
Conclusion
What should we draw from these employment market highlights?
- First, there clearly are growing labor force constraints on the job market. Job openings are going begging while exits from the labor force clearly exceed entrants.
- Second, there now is an unmistakable slowing in nonfarm employment growth. The monthly revisions of the past six months have generally been negative, and the positive numbers are smaller.
- And, third, the current job growth engines, healthcare and data centers, may not be where we want to bet our economic future. Healthcare for the elderly adds little to productivity growth and our AI future remains as highly leveraged as it is uncertain.
Given these circumstances, policymakers will have an even more difficult time discerning the correct path back to stronger growth.
Notes
- The Current Employment Statistics survey from the BLS is revised twice after the initial release. Today’s estimate is what BLS calls the “first closing.” Respondents have two more months to submit their surveys to BLS’s electronic collections centers, and sometimes these additional responses cause significant changes in the initial estimate. ↩
- See Cecilia Esterline, “Legal Immigration in Numbers: June 2026 Status Update,” at niskanencenter.org/immigrationdata, accessed on August 7, 2026. ↩
- Note that the labor force statistics are drawn from the Current Population Survey, which was not conducted in October 2025 due to a partial shutdown of the federal government. That explains why the labor force graphs above show a missing value for October. ↩