The Fiscal Lab Jobs Report for October 2026

Labor Market Strength
- Nonfarm payrolls rose by 165,000 in October, well above the roughly 60,000 economists expected, and BLS revised August and September up by a combined 84,000.
- Unemployment slipped to 4.1 percent, and labor force participation rose to 61.9 percent, a statistically significant three-month gain.
- Prices have outpaced average weekly earnings since 2021, which helps explain why voters feel worse off despite job gains.
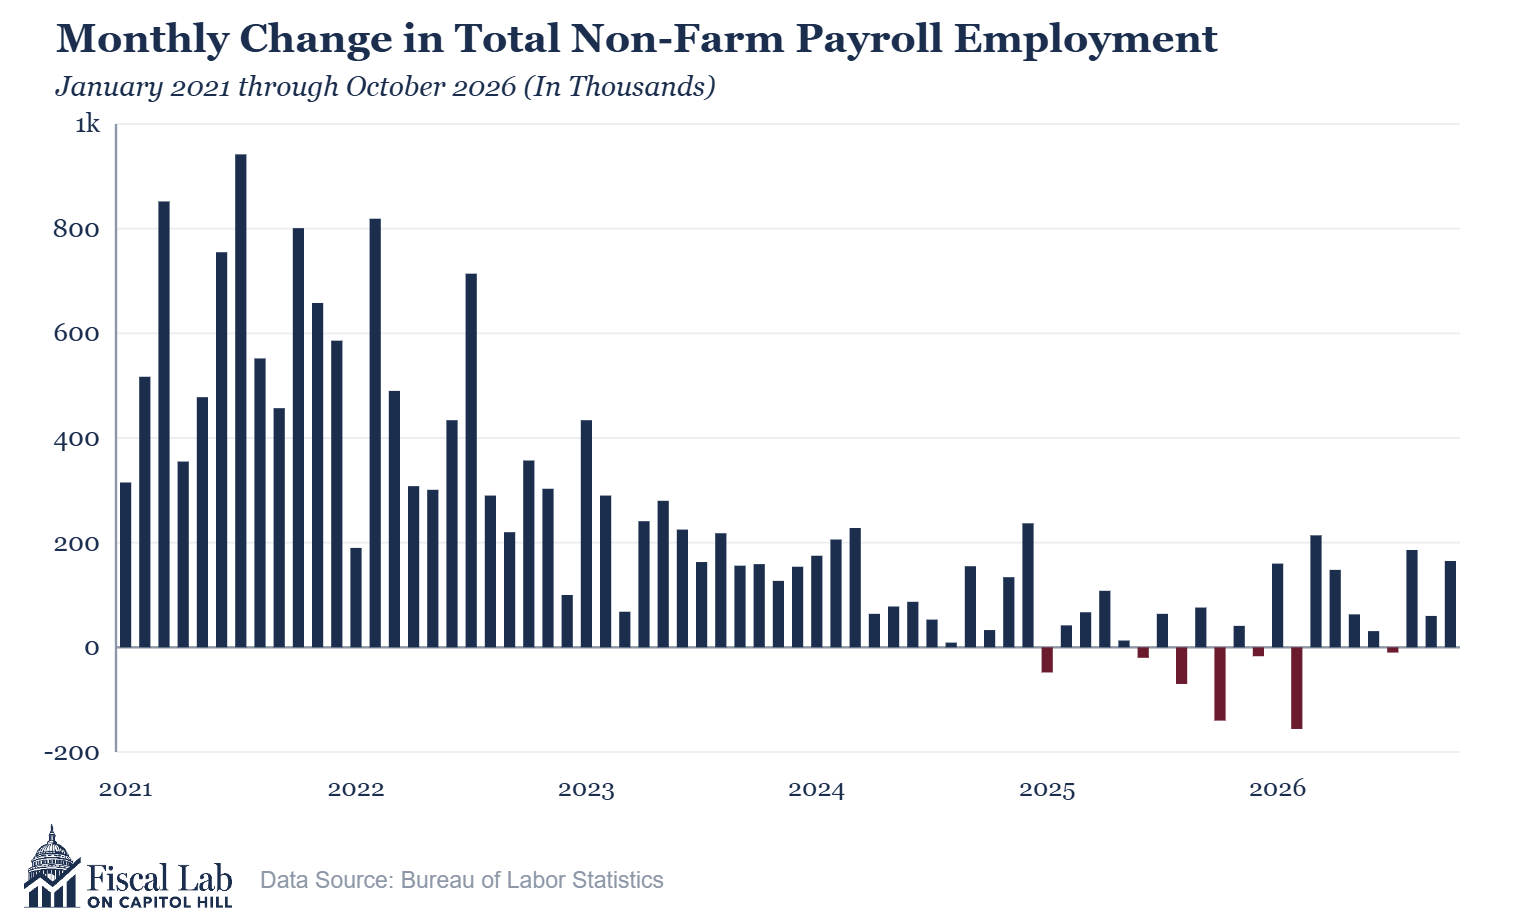
The Bureau of Labor Statistics (BLS) report on the October job market comes just days after an election that turned on how challenged voters feel by the economy. Thus, it might surprise some of these same voters that recent economic news has been pretty positive and that job gains for October outstripped economists’ expectations. Even though most economists forecast growth in total non-farm employment of about 60,000, BLS reported an initial estimate of 165,000, of which 159,000 stemmed from the private sector. Moreover, BLS revised upward its estimates for August and September. The August estimate grew by 53,000, and the September estimate increased by 31,000. All three of these estimates now indicate significant labor market strength.
Data Source: Bureau of Labor Statistics.
Strong growth in professional and business services (70,000), health care and social assistance (55,100), durable goods manufacturing (25,000), and transportation and warehousing (24,800) contributed the most to the overall employment gain.
If the jobs market looks healthy and unemployment remains steady (more on this later), then what did voters see that made them so negative about the current economic scene? Ascribing ignorance to voters is never advisable, since what voters see conditions how they act, and for analysts that’s pretty much all that matters. So, what are voters seeing?
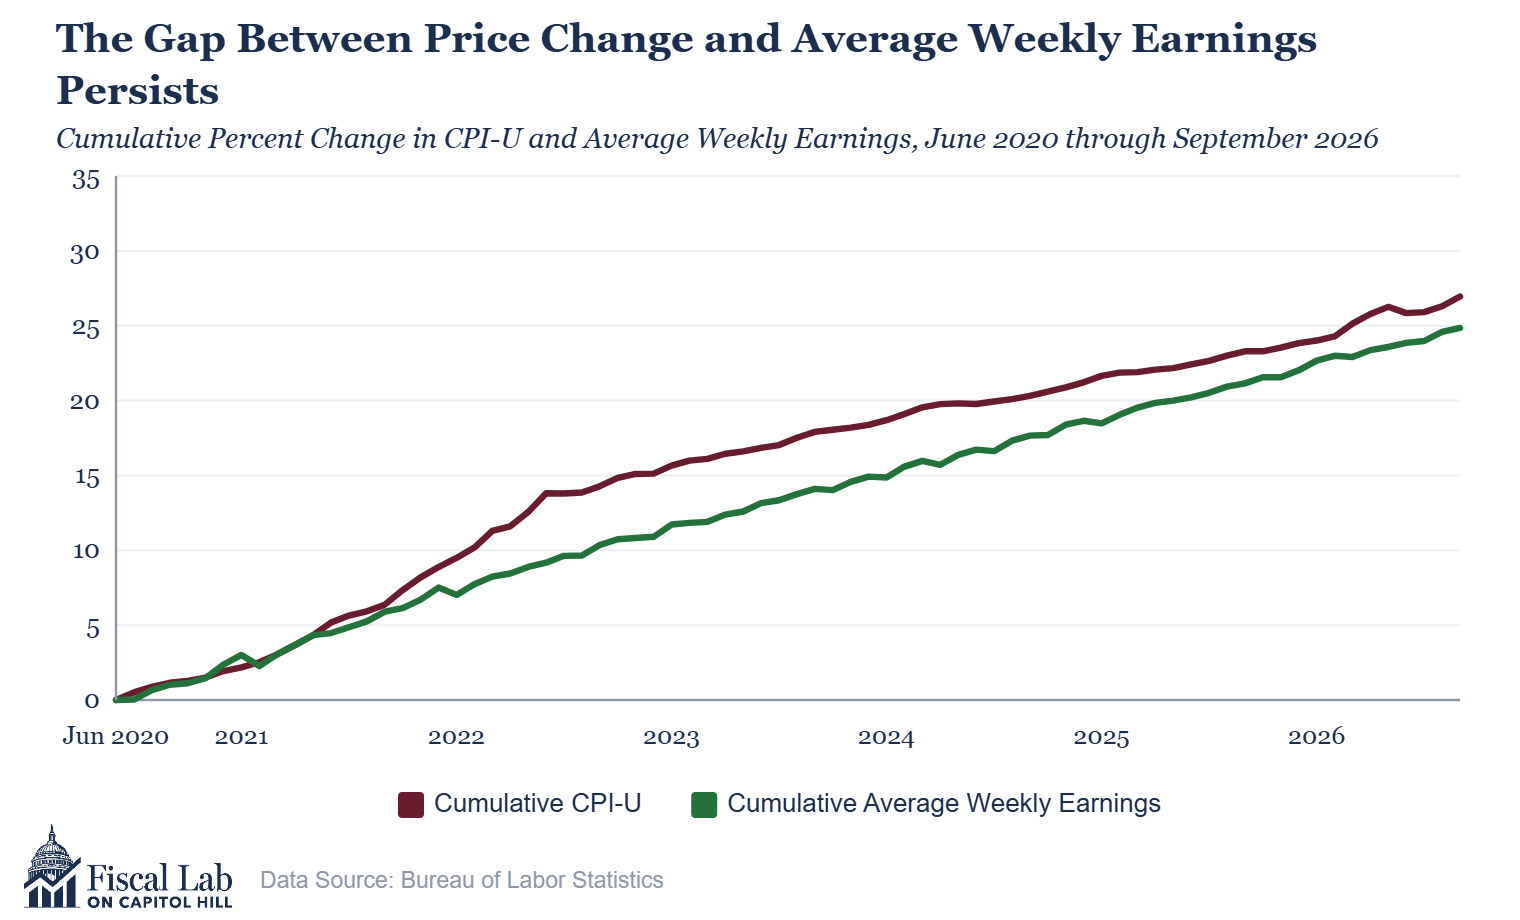
I think it is this: The long-run rate of growth in prices continues to outstrip the rate of growth in income (measured here by average weekly earnings), and earnings growth has not been strong enough recently to make up for the lost purchasing power of the past four years. Thus, voters rightly conclude that their standard of living has fallen, despite job gains and a relatively steady unemployment rate.
Data Source: Bureau of Labor Statistics.
The chart above shows the cumulative change in the Consumer Price Index since June of 2020, or a year before the explosive growth in the CPI. This series is contrasted with the cumulative growth in average weekly earnings, which has generally grown more slowly than the CPI. The CPI (as of the last reading in September) is growing at a 3.7 percent annual pace, which is just about equal to the growth in earnings: 3.76 percent. However, the perceived loss in purchasing power over time has yet to be overcome by earnings growth consistently faster than inflation. The gap since 2021 is the issue, and it will remain so until income growth restores purchasing power and, thus, a sense of where the standard of living should be relative to the voters’ incomes.
That said, higher income growth could be coming. BLS announced on November 5 that non-farm business sector labor productivity increased by 3.6 percent in the third quarter of 2026. Labor productivity is running at a 2.1 percent annual rate, which will put upward pressure on wage and salary growth. Why could this lead to income growth? Economic theory predicts increases in labor compensation if the value of the marginal product of labor exceeds the laborer’s marginal cost.
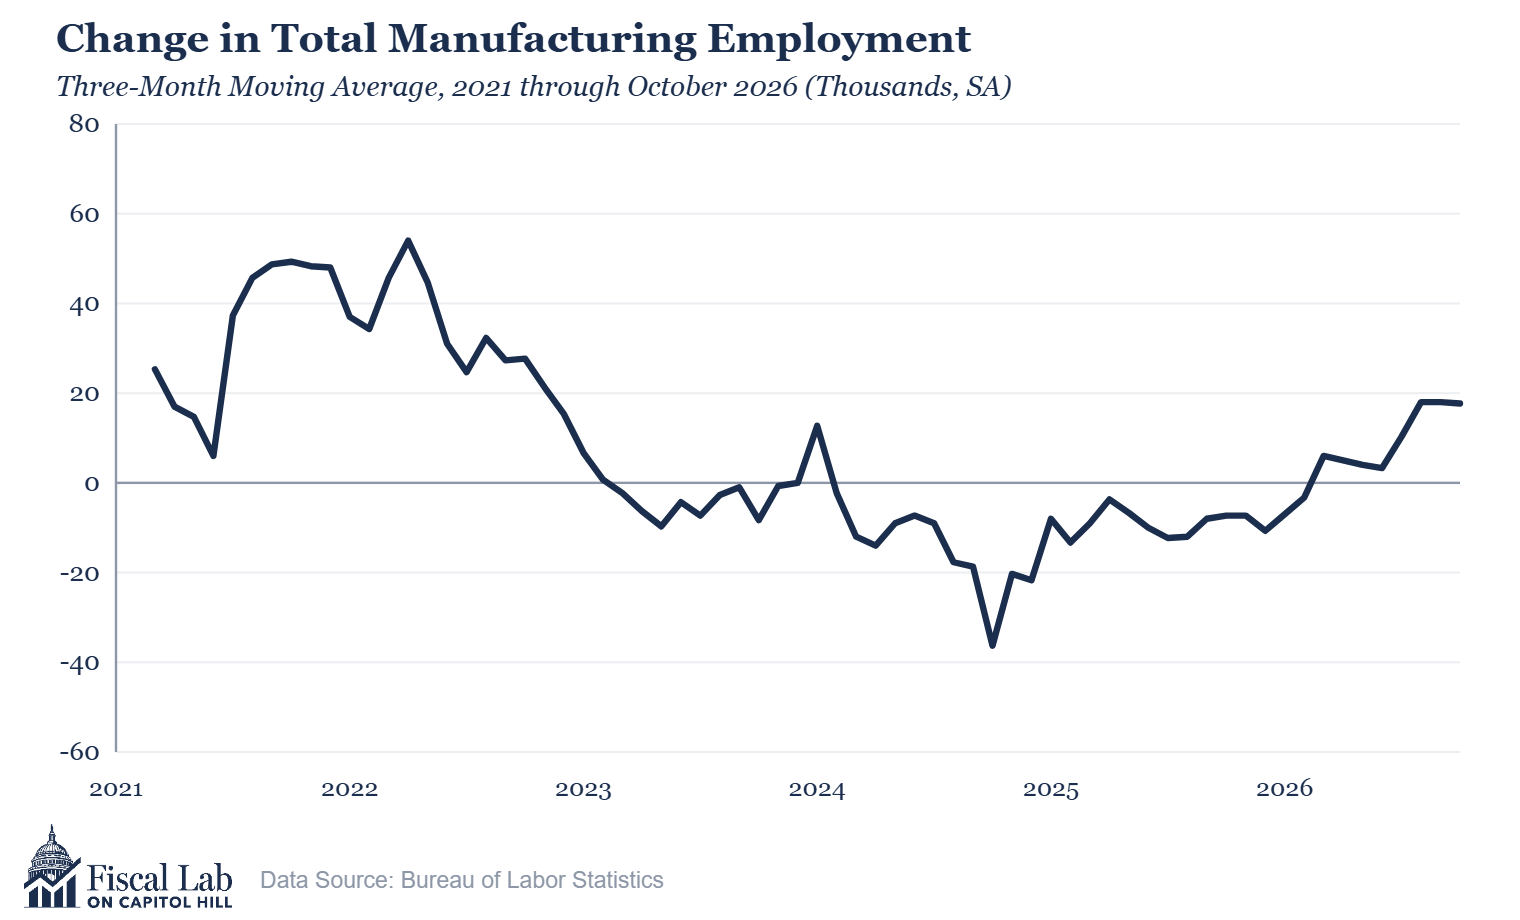
Manufacturing is a good example of where output growth, job gains, and productivity improvements are painting a brighter picture than we have seen in a long time.
Data Source: Bureau of Labor Statistics.
The figure above shows the three-month moving average of manufacturing jobs since 2021. BLS announced manufacturing job gains in October of 19,000. The overall manufacturing sector has grown by 101,000 since December of 2025. Much of this growth is happening in the durable goods subsector, where employment grew faster than the super sector at 25,000. Labor productivity in durable manufacturing is growing, too, at an annual rate of 1.9 percent, and compensation is increasing at a 5 percent annual rate.
Now, to the unemployment rate and other labor force indicators…
BLS reported that unemployment slipped down to 4.1 percent in October. Analysts had expected 4.2 percent, but the decrease was not statistically significant.
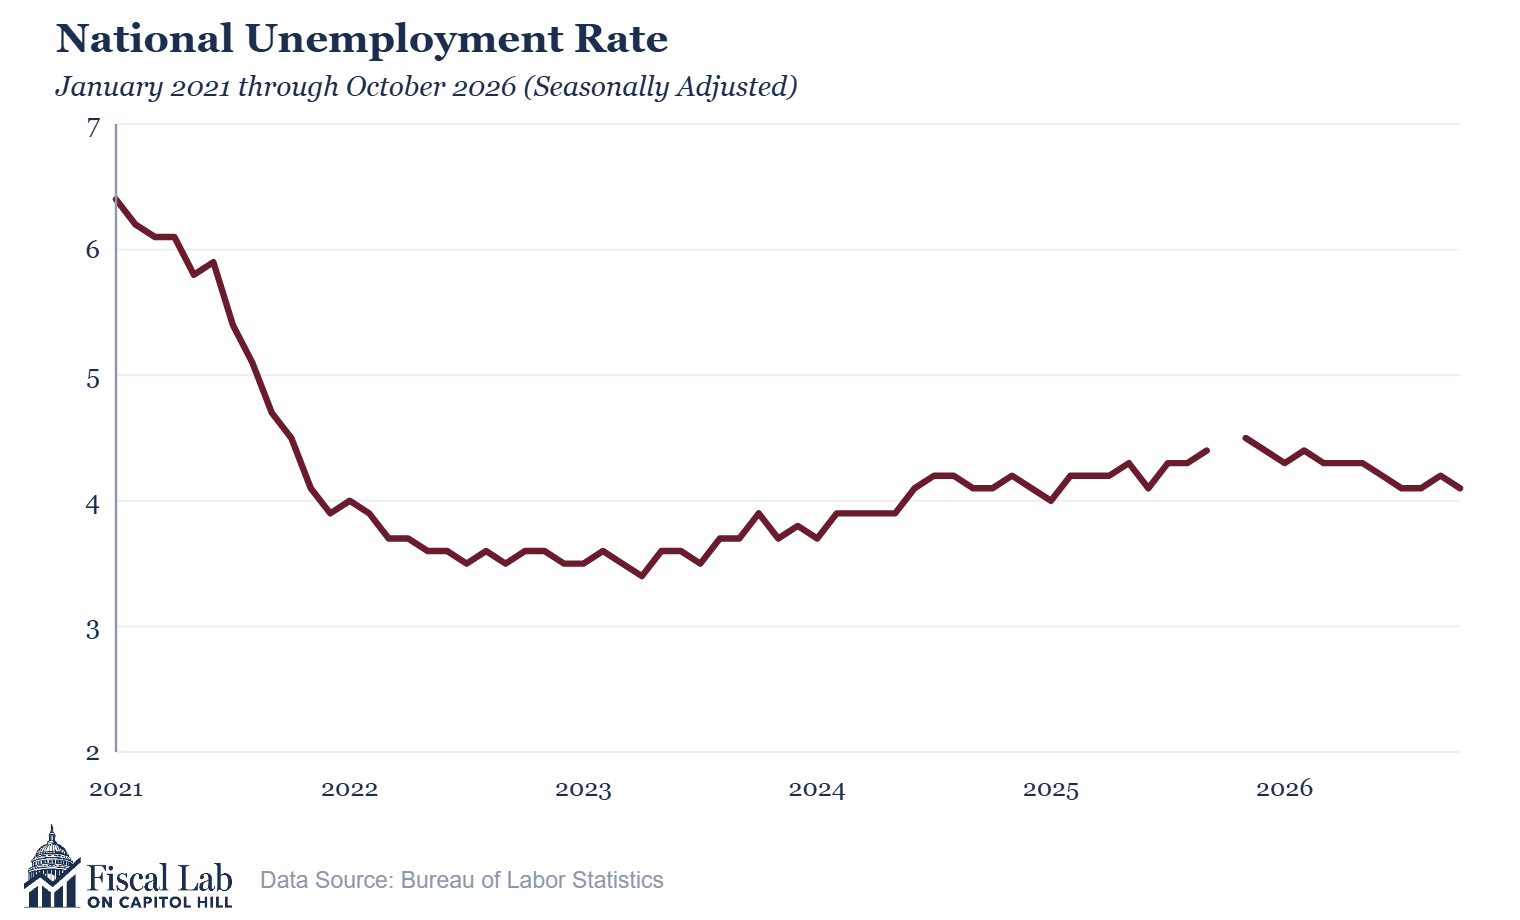
Data Source: Bureau of Labor Statistics.
The unemployment rate and the population of unemployed (7,068,000 in October) have changed very little in the last three months. Policymakers would like to see the unemployment rate a full 50 to 100 basis points lower than its current reading, which we have not seen since inflation began to slow hiring in 2023.
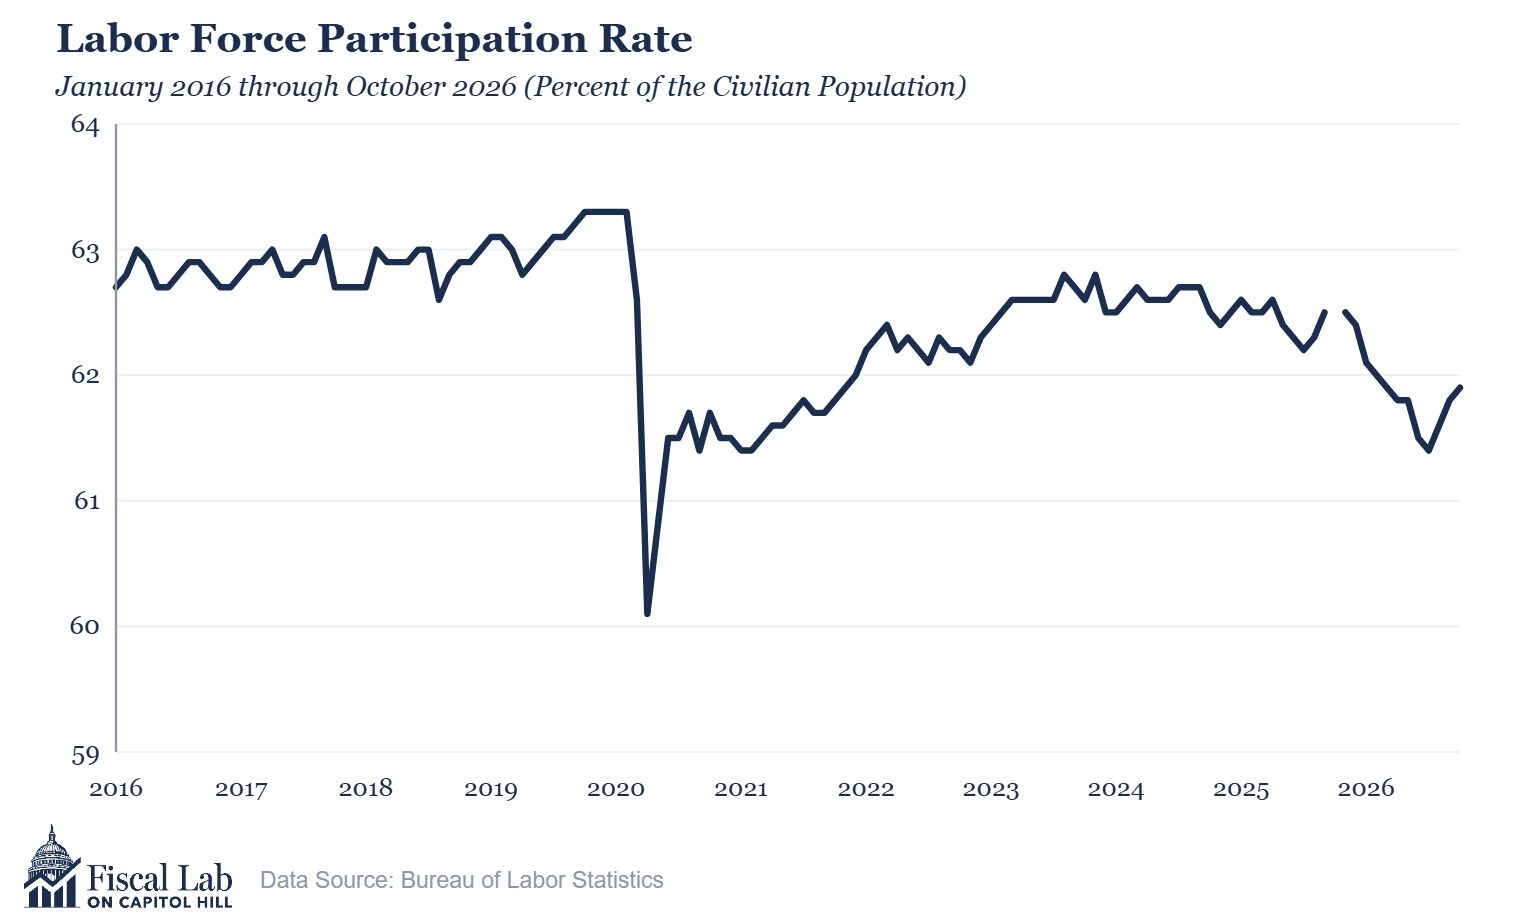
There are, however, signs of life in the labor force estimates when we look at the participation rate. BLS reported that this rate, which measures the percentage of the population 16 years and older who are working or actively looking for work, rose by 0.1 percentage point in October to a level of 61.9 percent. That one-month gain failed to be statistically significant, but the three-month gain of 0.5 percentage point is significant. Because the population of unemployed remains statistically unchanged, this gain in participation stems from the employed side of the labor force.
Data Source: Bureau of Labor Statistics.
The figure above shows a longer series than might be required for our report, but it shows two important stories. First and on the right-hand side of the graph, the rate is clearly turning up after a significant three-year slide. Second and on the left-hand side of the graph, the figure shows that recent gains have a long way to go before achieving labor force participation rates seen before the pandemic.
It may strike the reader that a 1-percentage-point gain in the rate is a small matter. However, the enormous size of the population aged 16 and above (275,682,000 in October) means that a 1-percentage-point gain is equal to a 2,756,000 increase in people employed or searching for work. That also means a return to the pre-pandemic level of participation of 63.3 percent, last seen in February 2020, would result in an additional 3,859,500 people either working or looking for work. That is more than half the size of the entire unemployed population, which stood at 7,068,000 in October.
The U.S. economy continues to amaze both its citizens and international observers. Despite the headwinds of war, inflation, tariffs, and ballooning deficits, the economy continues to grow and provide work for 164 million people and the opportunities for the 7 million looking for employment.
The current labor market numbers signal strength, but that does not guarantee continued vitality. Policymakers bear the burden of promoting widely shared prosperity by avoiding growth-killing policies. The recent election brings a large class of new policymakers to Washington and to state capitols. They should pause before taking office to appreciate this stunning American economy and meditate on the awesome responsibility the electorate has given them to execute their policy stewardship prudently.
The current labor market numbers signal strength, but that does not guarantee continued vitality.
William W. Beach is the Executive Director of the Fiscal Lab on Capitol Hill and the former Commissioner of the Bureau of Labor Statistics.